All sites on plan, Company on track to meet annual production and cost guidance
Tasiast, Paracatu and La Coipa deliver strong production, margins and cash flow
TORONTO, May 09, 2023 (GLOBE NEWSWIRE) -- Kinross Gold Corporation (TSX: K, NYSE: KGC) (“Kinross” or the “Company”) today announced its results for the first-quarter ended March 31, 2023.
This news release contains forward-looking information about expected future events and financial and operating performance of the Company. Please refer to the risks and assumptions set out in our Cautionary Statement on Forward-Looking Information located on page 28 of this release. All dollar amounts are expressed in U.S. dollars, unless otherwise noted.
Q1 2023 highlights from continuing operations:
-
The Company is on track to meet its 2023 annual guidance.
-
Production of 466,022 gold equivalent ounces (Au eq. oz.), a 23% year-over-year increase, and sales of 490,330 Au eq. oz.
-
Production cost of sales
1 of $987 per Au eq. oz. sold and all-in sustaining cost2 of $1,321 per Au eq. oz. sold.
-
Margins
3 of $907 per Au eq. oz. sold.
-
Operating cash flow
4 of $259.0 million and adjusted operating cash flow2 of $358.2 million.
-
Reported net earnings
5 of $90.2 million, or $0.07 per share, with adjusted net earnings2, 6 of $87.6 million, or $0.07 per share2.
-
Cash and cash equivalents of $471.0 million, and totalliquidity7 of approximately $1.7 billion at March 31, 2023.
- Kinross’ Board of Directors declared a quarterly dividend of $0.03 per common share payable on June 15, 2023 to shareholders of record at the close of business on June 1, 2023.
Operational and development project highlights:
- In the first quarter, Tasiast achieved two record-production months in January and March driven by record grades, and successfully completed a planned shutdown in February related to the Tasiast 24k expansion project. The Tasiast 24k project remains on budget and on schedule to reach 24,000 tonnes per day throughput in mid-2023.
-
Paracatu was a solid contributor with higher year-over-year production at lower costs.
-
La Coipa achieved record grades and recoveries since restarting operations last year and generated strong cash flow.
- The exploration program at Great Bear in Red Lake, Ontario, continues to make excellent progress. In 2023, Kinross expects to further delineate the deposit at depth and add inferred resource ounces. Drilling results continue to confirm gold mineralization at good widths and high grades, including at depths of 1.3 kilometres.
Environment, Social and Governance (ESG):
- Kinross published its 2022 Sustainability and ESG Report on May 9, 2023, detailing its refreshed ESG strategy as well as a comprehensive summary of its performance over the past year.
- In the most important area of safety, Kinross advanced its people-centric safety philosophy through new site level engagement programs and enhanced information sharing across operations.
- Bald Mountain was awarded the 2022 Reclamation Award for ‘Leadership in Concurrent Mine Reclamation.’
- Kinross advanced its Diversity, Equity and Inclusion (DEI) strategy in 2022, achieving the highest percentage of women employees at Kinross in the last five years, including the highest percentage of women in Science, Technology, Engineering and Mathematics (STEM) roles and 33% women on its Senior Leadership Team.
CEO commentary:
J. Paul Rollinson, President and CEO, made the following comments in relation to 2023 first-quarter results:
“Kinross delivered a strong first quarter with contributions from all of our sites resulting in a 23% increase in year-over-year production. Tasiast, La Coipa and Paracatu delivered strong production, margins and cash flow, including two record production months and record grades at Tasiast. Our U.S. operations delivered on plan as we continue to reinvest in our future with a focus on higher-margin opportunities.
“We continue to make excellent progress advancing our pipeline of development and exploration projects. The Tasiast 24k project is on schedule to reach nameplate capacity mid-year and the Tasiast solar power plant is expected to come online by the end of the year. At Great Bear, drilling results continue to confirm mineralization with good widths and high grades including at depths of more than one kilometre.
“Our portfolio of operations is well positioned and on track to deliver our annual production and cost guidance. We continue to maintain our financial strength and excellent liquidity, while bolstering our investment-grade balance sheet and continuing with our return of capital program.
“Mining responsibly and our strong commitment to ESG are integral to our business and are embedded in our culture and core values. We are pleased to publish our 2022 Sustainability and ESG Report which details our ESG strategy as well as another strong year of performance in this important area. Our goal is to be a partner of choice in the communities in which we operate while continuing to deliver meaningful and lasting benefits to all of our stakeholders. We remain focused on our commitment to reduce greenhouse gas emission intensity (on a per gold equivalent ounce basis) by 30% by 2030, driven by interim targets and a focus on continuous improvement and innovation.”
Summary of financial and operating results
|
|
Three months ended
|
|
|
March 31,
|
| (unaudited, in millions of U.S. dollars, except ounces, per share amounts, and per ounce amounts) |
2023
|
2022 |
Operating Highlights |
|
|
| Total gold equivalent ounces from continuing operations(a),(b) |
|
|
| Produced |
|
466,022
|
|
378,421 |
| Sold |
|
490,330
|
|
373,728 |
| |
|
|
|
Financial Highlights from Continuing Operations
(a)
|
|
|
| Metal sales |
$
|
929.3
|
$ |
700.9 |
| Production cost of sales |
$
|
483.9
|
$ |
363.1 |
| Depreciation, depletion and amortization |
$
|
211.9
|
$ |
166.5 |
| Operating earnings |
$
|
143.9
|
$ |
102.5 |
| Net earnings from continuing operations attributable to common shareholders |
$
|
90.2
|
$ |
81.3 |
| Basic earnings per share from continuing operations attributable to common shareholders |
$
|
0.07
|
$ |
0.06 |
| Diluted earnings per share from continuing operations attributable to common shareholders |
$
|
0.07
|
$ |
0.06 |
| Adjusted net earnings from continuing operations attributable to common shareholders(c) |
$
|
87.6
|
$ |
68.8 |
| Adjusted net earnings from continuing operations per share(c) |
$
|
0.07
|
$ |
0.05 |
| Net cash flow of continuing operations provided from operating activities |
$
|
259.0
|
$ |
97.9 |
| Adjusted operating cash flow from continuing operations(c) |
$
|
358.2
|
$ |
249.1 |
| Capital expenditures from continuing operations(d) |
$
|
221.2
|
$ |
100.7 |
| Free cash flow from continuing operations(c) |
$
|
37.8
|
$ |
(2.8 |
| Average realized gold price per ounce from continuing operations(e) |
$
|
1,894
|
$ |
1,876 |
| Production cost of sales from continuing operations per equivalent ounce(b) sold(f) |
$
|
987
|
$ |
972 |
| Production cost of sales from continuing operations per ounce sold on a by-product basis(c) |
$
|
929
|
$ |
966 |
| All-in sustaining cost from continuing operations per ounce sold on a by-product basis(c) |
$
|
1,284
|
$ |
1,227 |
| All-in sustaining cost from continuing operations per equivalent ounce(b) sold(c) |
$
|
1,321
|
$ |
1,231 |
| Attributable all-in cost(g) from continuing operations per ounce sold on a by-product basis(c) |
$
|
1,616
|
$ |
1,466 |
| Attributable all-in cost(g) from continuing operations per equivalent ounce(b) sold(c) |
$
|
1,634
|
$ |
1,468 |
|
(a)
|
Results for the three months ended March 31, 2023 and 2022 are from continuing operations and exclude results from the Company’s Chirano and Russian operations due to the classification of these operations as discontinued and their later sale in 2022. The comparative information for the three months ended March 31, 2022, as previously presented in the MD&A and financial statements for the three months ended March 31, 2022, has been updated retrospectively to exclude results from the Company’s Chirano operations.
|
|
(b)
|
“Gold equivalent ounces” include silver ounces produced and sold converted to a gold equivalent based on a ratio of the average spot market prices for the commodities for each period. The ratio for the first quarter of 2023 was 83.82:1 (first quarter of 2022 - 78.19:1).
|
|
(c)
|
The definition and reconciliation of these non-GAAP financial measures and ratios is included on pages 17 to 22 of this news release. Non-GAAP financial measures and ratios have no standardized meaning under IFRS and therefore, may not be comparable to similar measures presented by other issuers.
|
|
(d)
|
“Capital expenditures from continuing operations” is as reported as “Additions to property, plant and equipment” on the interim condensed consolidated statements of cash flows.
|
|
(e)
|
“Average realized gold price per ounce from continuing operations” is defined as gold metal sales from continuing operations divided by total gold ounces sold from continuing operations.
|
|
(f)
|
“Production cost of sales from continuing operations per equivalent ounce sold” is defined as production cost of sales divided by total gold equivalent ounces sold from continuing operations.
|
|
(g)
|
“Attributable all-in cost” includes Kinross’ share of Manh Choh (70%) costs.
|
| |
|
The following operating and financial results are based on first-quarter gold equivalent production:
Production: Kinross produced 466,022 Au eq. oz. in Q1 2023 from continuing operations, compared with 378,421 Au eq. oz. in Q1 2022. The 23% year-over-year increase was primarily attributable to the ramp up of production at La Coipa in 2022 and higher production at Paracatu, Round Mountain and Fort Knox.
Sales: Kinross sold 490,330 Au eq. oz. in Q1 2023 from continuing operations, compared with 373,728 Au eq. oz. in Q1 2022. The year-over-year increase is primarily due to higher production and timing of gold equivalent ounces sold.
Average realized gold price: The average realized gold price from continuing operations in Q1 2023 was $1,894 per ounce, compared with $1,876 per ounce in Q1 2022.
Revenue: During the first quarter, revenue from continuing operations increased to $929.3 million, compared with $700.9 million during Q1 2022. The 33% increase is due to an increase in gold equivalent ounces sold and an increase in average realized gold price.
Production cost of sales: Production cost of sales1 from continuing operations per Au eq. oz. sold was $987 for the quarter, compared with $972 in Q1 2022, primarily due to higher costs at the Company’s Nevada operations, largely offset by increased production.
Production cost of sales from continuing operations per Au oz. sold2 on a by-product basis was $929 in Q1 2023, compared with $966 in Q1 2022, based on gold sales of 461,696 ounces and silver sales of 2,400,198 ounces.
Margins
3: Kinross’ margin from continuing operations per Au eq. oz. sold was $907 for Q1 2023, in line with the Q1 2022 margin of $904.
All-in sustaining cost
2: All-in sustaining cost from continuing operations per Au eq. oz. sold was $1,321 in Q1 2023, compared with $1,231 in Q1 2022.
In Q1 2023, all-in sustaining cost from continuing operations per Au oz. sold on a by-product basis was $1,284, compared with $1,227 in Q1 2022.
Operating cash flow: Operating cash flow from continuing operations4 was $259.0 million for Q1 2023, compared with $97.9 million for Q1 2022.
Adjusted operating cash flow from continuing operations2 increased to $358.2 million in Q1 2023, compared with $249.1 million for Q1 2022.
Free cash flow
2
: Free cash flow from continuing operations in Q1 2023 was $37.8 million, which includes total working capital changes8 representing an outflow of $99.2 million, compared with a net outflow of $2.8 million in Q1 2022, which included total working capital changes8 representing an outflow of $151.2 million.
Earnings: Reported net earnings5 from continuing operations was $90.2 million, or $0.07 per share for Q1 2023, compared with reported net earnings of $81.3 million, or $0.06 per share, for Q1 2022. The increase in reported net earnings was mainly due to the increase in margins.
Adjusted net earnings from continuing operations2,6 was $87.6 million, or $0.07 per share, for Q1 2023, compared with $68.8 million, or $0.05 per share, for Q1 2022.
Capital expenditures: Capital expenditures from continuing operations increased to $221.2 million for Q1 2023, compared with $100.7 million for Q1 2022, primarily due to an increase in capital stripping at Tasiast, Fort Knox and Bald Mountain and development activities at Manh Choh.
Balance sheet
As of March 31, 2023, Kinross had cash and cash equivalents of $471.0 million, compared with $418.1 million at December 31, 2022.
The Company had additional available credit9 of approximately $1.3 billion and total liquidity7 of approximately $1.7 billion.
Return of capital
As part of its continuing quarterly dividend program, the Company declared a dividend of $0.03 per common share payable on June 15, 2023, to shareholders of record as of June 1, 2023.
Under the Company’s current share buyback program, the amount of capital returned through buybacks is based on excess cash (defined as free cash flow after paying interest and dividends) generated in each quarter, with actual share repurchases occurring on a one quarter lag basis. As such, there were no repurchases in the first quarter and the Company expects to repurchase shares in the second half of the year.
Operating results
Mine-by-mine summaries for 2023 first-quarter operating results may be found on pages 12 and 16 of this news release. Across the portfolio, all projects are on plan and met quarterly production targets. Highlights include the following:
At Tasiast, production was lower quarter-over-quarter and year-over-year primarily due to lower throughput as a result of the planned shutdown in February mainly for tie-ins at the Tasiast 24k project. Notwithstanding the planned shutdown, monthly production records were achieved in both January and March as the lower quarter-over-quarter throughput was partially offset by improving recoveries and record-high grades as a result of mine sequencing. Cost of sales per ounce sold was higher compared with the previous quarter due to lower production, and lower year-over-year mainly due to lower operating waste mined in the first quarter of 2023.
At Paracatu, production was on plan and increased year-over-year primarily due to higher throughput, grades and recoveries, and decreased quarter-over-quarter mainly due to expected lower grades and recoveries as a result of planned mine sequencing, partially offset by higher throughput. Cost of sales per ounce sold was lower year-over-year mainly due to increased production and higher quarter-over-quarter mainly due to lower production.
At Fort Knox, production was lower compared with the previous quarter mainly due to the seasonal effect of fewer ounces recovered from the heap leach pads. Year-over-year production increased largely due to higher mill production as a result of higher grades processed. Production cost of sales per ounce sold was in line quarter-over-quarter, and lower year-over-year due to higher production.
At Round Mountain, production was slightly lower than the previous quarter mainly due to fewer ounces recovered from the heap leach pads. Production increased year-over-year due to an increase in ounces recovered from the heap leach pads. Cost of sales per ounce sold increased quarter-over-quarter due to lower production and lower capital development, and increased year-over-year due to inflationary cost pressures on power and reagent costs, maintenance supplies and lower capital development.
At Bald Mountain, production decreased quarter-over-quarter mainly due to fewer ounces recovered from the heap leach pads related to a decrease in tonnes placed on the heap leach pads, partially offset by higher grades. Year-over-year production decreased mainly due to fewer tonnes placed on the heap leach pads and lower grades. Cost of sales per ounce sold increased quarter-over-quarter due to lower production and year-over-year largely due to higher reagent costs and royalties. The unprecedented winter snowfall had an impact on mining and stacking activities at Bald Mountain, however the site achieved quarterly production targets and has made strong progress catching up on mining activities in April.
At La Coipa, production was lower compared with the previous quarter mainly due to the planned mill shutdown to increase mill reliability, resulting in lower throughput, partially offset by higher grades and strong recoveries. Cost of sales per ounce sold increased quarter-over-quarter mainly due to lower production. The Company continues to focus on optimizing the plant and maintaining the outperformance on recovery, and production at La Coipa remains on plan for the year. La Coipa poured first gold in February 2022 and ramped up in the second half of the year.
Development projects and exploration update
Tasiast
The Tasiast 24k project continues to progress on budget and on schedule to reach designed throughput of 24,000 t/d by mid-year and ramp-up to operate consistently at this design throughput by the end of the year. The successful execution of the mill shutdown in February put into operation a new vibrating screen at the SAG discharge, as well as an upgrade to a higher capacity SAG primary cyclone cluster. Mechanical and electrical installation works are substantially advanced on the pre-classification circuit (the remaining 24k debottlenecking scope), with pre-commissioning of subsystems having commenced in April and phased commissioning expected to continue through to the end of June. A shutdown is planned in June in connection with the 24k expansion project.
The 34MW Tasiast solar power plant continues to advance and is on schedule for completion by the end of the year. All photovoltaic modules have arrived and procurement is substantially complete with all critical equipment on site or in transit. Civil works are well advanced and mechanical assembly installation is progressing well as the installation of the first photovoltaic modules started in April.
Great Bear
The Company continues to make excellent progress at the Great Bear project in Red Lake, Ontario. In the first quarter, Kinross drilled approximately 38,000 metres as part of its robust exploration and infill drilling program. Kinross’ focus this year is on inferred drilling in the area half a kilometre to one kilometre below surface. This work will be complemented by exploration drilling along strike of the LP Fault zone and around the Hinge and Limb zones that have seen little exploration drilling for new mineralization beyond the known zones, with the goal of further delineating the deposit at depth as well as adding inferred resource ounces.
Since its last update on February 13, 2023, the Company has received additional assay results, with a selection of the new results from targets at the LP Fault and Limb zones highlighted in the table below. Notable exploration results at Great Bear in the first quarter include:
- BR-695 (Yuma) – 9.6m @ 10.5 g/t at a depth of 1,300m
- BR-697A (Yuma) – 38m @ 5.2 g/t, including 4.2m @ 32.4 g/t, at a depth of 800m
- BR-735 (Viggo) – 2.6m @ 73 g/t, at a depth of 100m
- DL-132 (Limb) – 5.9m @ 7.8 g/t at a depth of 900m
Results-to-date continue to support the view of a high-grade deposit that underpins the prospect of a large, long-life mining complex with the recent results continuing to demonstrate the high-grade nature of the mineralization. Hole BR-695, the deepest hole to date on the property, intersected a 9.6m interval at 10.5 g/t gold at a vertical depth of 1.3 kilometres. The latest results also confirm the system has broad zones of mineralization as seen in hole BR-697A that intersected a 38m interval at 5.2 g/t gold including a 4.2m interval of 32.4 g/t gold, at a vertical depth of 800m. Hole BR-735 intersected 2.6m at 73 g/t gold at a vertical depth of 100m and extends the strike length of the Viggo mineralization. In the Limb zone (Red Lake style of mineralization) hole DL-132 intersected 5.9m of 7.8 g/t gold at a vertical depth of 900m, once again demonstrating that this system also continues at depth.
The Company is also progressing studies and permitting for an advanced exploration program that would establish an underground decline to obtain a bulk sample and allow for more efficient exploration of deeper areas of the LP Fault zone, along with the nearby Hinge and Limb gold zones. Kinross is targeting a potential start of the surface construction for the advanced exploration program as early as 2024.
Baseline environmental surveys, local community socio-economic studies and engineering activities required for the permitting process for the main project are progressing well. The Company continues to work together to build a mutually beneficial relationship with the Wabauskang and Lac Seul First Nations, on whose traditional territories the project is located, and is providing support for their technical resources in the area of environmental monitoring. Kinross continues to advance technical studies and permitting activities, with plans to release the results of this work in the form of a preliminary economic assessment in 2024.
Selected Great Bear Drill Results
See Appendix A for full results.
|
Hole ID
|
|
From
(m)
|
To
(m)
|
Width
(m)
|
True
Width (m)
|
Au
(g/t)
|
Target
|
|
BR-655
|
|
542.9 |
592.2 |
49.3 |
36.0 |
2.88 |
Discovery |
|
BR-655
|
including |
549.0 |
552.9 |
3.9 |
2.8 |
3.52 |
|
|
BR-655
|
and including |
577.8 |
585.9 |
8.1 |
5.9 |
12.09 |
|
|
BR-655
|
and |
598.3 |
610.0 |
11.7 |
8.7 |
1.11 |
|
|
BR-655
|
and |
628.8 |
632.0 |
3.3 |
2.5 |
0.53 |
|
|
BR-655
|
and |
648.0 |
652.2 |
4.1 |
3.5 |
0.83 |
|
|
BR-655
|
and |
688.5 |
695.5 |
7.0 |
5.2 |
3.44 |
|
|
BR-655
|
including |
688.5 |
693.8 |
5.3 |
3.9 |
3.96 |
|
|
BR-655
|
and |
708.0 |
712.5 |
4.5 |
3.8 |
0.51 |
|
|
BR-695
|
|
1,363.8 |
1,373.3 |
9.5 |
8.6 |
2.07 |
Yuma |
|
BR-695
|
including |
1,363.8 |
1,367.4 |
3.6 |
3.3 |
5.02 |
|
|
BR-695
|
|
1,530.0 |
1,551.0 |
21.0 |
19.1 |
1.14 |
|
|
BR-695
|
|
1,556.5 |
1,602.2 |
45.7 |
41.6 |
2.71 |
|
|
BR-695
|
including |
1,556.5 |
1,567.0 |
10.6 |
9.6 |
10.46 |
|
|
BR-695
|
including |
1,561.4 |
1,565.0 |
3.7 |
3.3 |
24.38 |
|
|
BR-695
|
|
1,617.2 |
1,620.0 |
2.8 |
2.5 |
5.31 |
|
|
BR-697A
|
|
968.8 |
971.8 |
3.0 |
2.8 |
0.46 |
Yuma |
|
BR-697A
|
and |
1,004.2 |
1,046.2 |
42.1 |
38.0 |
5.24 |
|
|
BR-697A
|
including |
1,027.4 |
1,032.0 |
4.7 |
4.2 |
32.35 |
|
|
BR-697A
|
and |
1,044.2 |
1,044.9 |
0.8 |
0.7 |
64.50 |
|
|
BR-719
|
|
620.7 |
627.6 |
6.8 |
5.3 |
0.82 |
Bruma |
|
BR-719
|
and |
680.4 |
706.3 |
25.9 |
19.4 |
2.05 |
|
|
BR-719
|
including |
682.0 |
694.0 |
12.0 |
9.0 |
3.66 |
|
|
BR-735
|
|
120.0 |
123.0 |
3.0 |
2.6 |
73.18 |
Viggo |
|
BR-735
|
including |
121.5 |
123.0 |
1.5 |
1.3 |
146.00 |
|
|
BR-794
|
|
942.0 |
953.5 |
11.5 |
9.0 |
3.77 |
Yauro |
|
BR-794
|
including |
942.0 |
944.0 |
2.0 |
1.6 |
6.54 |
|
|
BR-794
|
and including |
952.0 |
952.8 |
0.8 |
0.6 |
35.60 |
|
|
BR-794
|
and |
964.0 |
972.0 |
8.0 |
7.0 |
24.38 |
|
|
BR-794
|
and |
997.4 |
1,013.0 |
15.7 |
11.4 |
1.76 |
|
|
BR-794
|
and |
1,083.6 |
1,088.7 |
5.1 |
3.9 |
1.23 |
|
|
DL-132
|
|
898.1 |
904.8 |
6.7 |
5.4 |
3.62 |
Limb |
|
DL-132
|
including |
899.1 |
904.8 |
5.7 |
4.6 |
4.14 |
|
|
DL-132
|
and |
1,059.9 |
1,066.7 |
6.8 |
5.9 |
7.75 |
|
|
DL-132
|
including |
1,060.9 |
1,061.5 |
0.6 |
0.5 |
76.40 |
|
Results are preliminary in nature and are subject to on-going QA/QC. Lengths are subject to rounding.
See Appendix B for a LP Fault zone long section.
Manh Choh
At the 70% owned Manh Choh project, activities remain on schedule and on budget, with the early works program completed successfully. The camp is now operational, supporting the construction activities underway, and is being managed by an Alaska-based firm. Long lead procurement orders have been expedited and onboarding of key construction and operational contractors continues to advance as planned for both the Manh Choh site and Fort Knox mill modifications. The public comment period for the operating permits was successfully completed and the overall permitting process remains on track. The Company continues to plan for the construction ramp-up with a steadfast focus on developing the mine while keeping the safety of our people and the environment at the forefront and continuing to build strong relationships with communities and the Native Village of Tetlin.
The Company announced on July 27, 2022, that it was proceeding with the Manh Choh project as the operator of the joint venture. Initial production from Manh Choh is expected in the second half of 2024 and is expected to add approximately 640,000 attributable Au eq. oz. to the Company’s production profile over its approximately 4.5 year life-of-mine.
Chile
Kinross’ activities in Chile are currently focused on La Coipa and potential opportunities to extend its mine life. The Lobo-Marte project continues to provide optionality as a potential large, low-cost mine upon the conclusion of mining at La Coipa. While the Company focuses its technical resources on La Coipa, it will continue to engage and build relationships with communities related to Lobo-Marte and government stakeholders.
Curlew Basin exploration
At the Curlew Basin exploration project in Washington State, located approximately 35 kilometres north of the Company’s Kettle River mill by paved road, underground exploration drill results continue to confirm vein extensions and continuity within high priority target areas. Exploration drilling is underway and will continue throughout the remainder of the year with the goal of building on the resource.
Exploration drill results received during the quarter include:
- LP – 3.0m @ 37.3 g/t Au and 6.9m @ 11.7 g/t Au (1136 & 1135)
- K5N – 2.3m @ 24.2 g/t Au and 2.7m @ 20.7 g/t Au (1402)
- K5S – 2.8m @ 10.6 g/t Au and 4.8m @ 8.75 g/t Au (1147)
Round Mountain Phase X and Gold Hill exploration
Kinross continues to focus on progressing the higher-margin, higher-return underground opportunities at Phase X and Gold Hill.
Construction of the exploration decline at Phase X started in the first quarter and underground development is progressing to start definition drilling in early 2024. The Company is also advancing studies and permitting for a potential underground mine at Phase X in parallel with the underground development to advance our path to production.
Phase X is a continuation of the world-class Round Mountain low sulfidation epithermal system (over 16Moz. produced which consists of disseminated gold hosted in a rhyolite tuff). This mineralized zone progressively deepens westward due to a combination of a gentle west-dip and down-dropping along a series of ‘Basin and Range’ faults.
At the Gold Hill exploration project, located approximately seven kilometres northeast of Round Mountain, drilling commenced early this year with four drill rigs and permitting for an underground decline is progressing. Exploration drilling is focused on extending the Jersey vein and testing continuity of the mid-Atlantic vein zone. Drilling thus far has successfully intersected the targeted veins and assays will be included in the Company’s second quarter results.
Gold Hill is a low sulfidation epithermal vein system consisting of high-grade narrow quartz veins with significant strike continuity. Historic underground mining (current pit area) produced approximately 40koz with a grade of 10g/t Au.
Company Guidance
The following section of the news release represents forward-looking information and users are cautioned that actual results may vary. We refer to the risks and assumptions contained in the Cautionary Statement on Forward-Looking Information on page 28.
The Company is on track to meet its 2023 production guidance of 2.1 million Au eq. oz. (+/- 5%). Production is expected to increase following the first quarter, largely driven by expected higher production at Tasiast and La Coipa, as well as the seasonal impacts on mining at Paracatu and the Company’s US heap leach operations. Kinross’ annual production is expected to remain stable in 2024 and 2025 at 2.1 million and 2.0 million attributable10 Au eq. oz. (+/- 5%), respectively.
The Company is also on track to meet its 2023 guidance for production cost of sales, all-in sustaining cost and attributable11 capital expenditures.
Environment, Social and Governance (ESG) update
Kinross published its 2022 Sustainability and ESG Report on May 9, 2023, detailing its approach to sustainability, its ESG strategy and strong performance in this area over the past year. At the core of Kinross’ business is its commitment to safety and the health of its people, environmental stewardship, and the well-being of its host communities.
Access the full Sustainability and ESG Report here: www.kinross.com/2022-Sustainability-and-ESG-Report
For highlights of the Report, read here: www.kinross.com/Kinross-release-2022-Sustainability-and-ESG-Report
Kinross’ updated ESG strategy outlines three key pillars – Workforce and Community, Natural Capital, and Climate and Energy – through to 2030 and beyond as priority focus areas to make strong contributions and build shared value.
Kinross’ leading performance was reinforced by continued high ratings and rankings within our peer group. The Company achieved its highest S&P ESG Global rating in 2022, ranking in the 97th percentile, the highest ever placement for Kinross, improved its Sustainalytics risk rating score with a significant 10-point increase, and maintained its ‘A’ position with MSCI for the third-consecutive year.
Kinross obtained external assurance of both selected ESG performance metrics and conformance with the Responsible Gold Mining Principles established by the World Gold Council and, following the Company’s normal practice, has provided Global Reporting Initiative (GRI) and Sustainability Accounting Standards Board (SASB) indices.
Other highlights from the 2022 Sustainability and ESG Report include:
- In the most important area of safety, improvements were made across all leading areas including a “Critical Risk Management Blitz” to identify opportunities and weaknesses and launching a new Global Safety Learning Forum to advance Kinross’ people-centric safety philosophy through site level engagement and information sharing across operations.
- In 2022, Kinross generated $2.9 billion in economic benefits in its host countries through taxes, wages, procurement and community support, including donations. Since 2010, $44 billion has been contributed to the economies of Kinross’ host countries.
- Kinross made strides in its DEI strategy achieving the highest percentage of women employees at Kinross in the last five years, including the highest percentage of women in STEM roles at 15% and the highest percentage of women in management positions, including 33% women on its Senior Leadership Team. At sites, high-levels of in-country employment were maintained with 99% of non-management employees and 87% of management from within host countries.
- For reclamation efforts that go beyond standard reclamation requirements, Bald Mountain was awarded the 2022 Reclamation Award for ‘Leadership in Concurrent Mine Reclamation’ from the Nevada Division of Environmental Protection, Nevada Department of Wildlife (NDOW), US Forest Service, US Bureau of Land Management (BLM) and the Nevada Division of Minerals.
In the first quarter of 2023, Kinross maintained its strong ESG performance, including setting up a cross-functional Corporate Human Rights Task Force that is focused on delivering a four-part action plan. In host communities, more than $1.3 million of monetary and in-kind contributions were made through site community investment strategies and a high level of stakeholder interaction was maintained.
Kinross maintained close engagement with Indigenous communities related to its projects and operations, including advancing discussions with the Wabauskang and Lac Seul First Nations on how the Great Bear project can provide long-lasting benefits to their communities. At Manh Choh, the Alaska Department of Labor and Workforce Development provided the University of Alaska Fairbank’s Mining and Training Petroleum Service program with a $300,000 grant, in partnership with Kinross Alaska, to support local communities with the training and skills needed to secure jobs at Manh Choh. In Chile, eight members of the Colla indigenous communities related to La Coipa and Lobo Marte graduated from an adult education program. Learn more about Kinross’ work with the Colla community here: https://youtu.be/4we2gHyBEWg.
Conference call details
In connection with this news release, Kinross will hold a conference call and audio webcast on Wednesday, May 10, 2023, at 7:45 a.m. EDT to discuss the results, followed by a question-and-answer session. To access the call, please dial:
Canada & US toll-free – 1 (888) 330-2446; Passcode: 4915537
Outside of Canada & US – 1 (240) 789-2732; Passcode: 4915537
Replay (available up to 14 days after the call):
Canada & US toll-free – 1-800-770-2030; Passcode: 4915537
Outside of Canada & US – 1-647-362-9199; Passcode: 4915537
You may also access the conference call on a listen-only basis via webcast at our website www.kinross.com. The audio webcast will be archived on www.kinross.com.
This release should be read in conjunction with Kinross’ 2023 first-quarter unaudited Financial Statements and Management’s Discussion and Analysis report at www.kinross.com. Kinross’ 2023 first-quarter unaudited Financial Statements and Management’s Discussion and Analysis have been filed with Canadian securities regulators (available at www.sedar.com) and furnished with the U.S. Securities and Exchange Commission (available at www.sec.gov). Kinross shareholders may obtain a copy of the financial statements free of charge upon request to the Company.
Virtual Annual Meeting of Shareholders
Kinross’ Annual Meeting of Shareholders will be held on Wednesday, May 10, 2023, at 10:00 a.m. EDT.
The Company has elected to hold a virtual meeting via a live audio webcast to provide enhanced flexibility and opportunity for shareholder participation irrespective of their geographic location and share ownership. Further, with advancements in conferencing technology and the residual impacts of the COVID-19 pandemic, Kinross believes this expedient approach will still provide the same level of disclosure, transparency and participation as previous meetings.
The virtual meeting will be accessible online at: web.lumiagm.com/417158950.
Voting and participation instructions for eligible shareholders are provided in the Company’s Notice of Annual Meeting of Shareholders and Management Information Circular.
The link to the virtual meeting will also be accessible at www.kinross.com and will be archived for later use.
About Kinross Gold Corporation
Kinross is a Canadian-based global senior gold mining company with operations and projects in the United States, Brazil, Mauritania, Chile and Canada. Our focus is on delivering value based on the core principles of responsible mining, operational excellence, disciplined growth, and balance sheet strength. Kinross maintains listings on the Toronto Stock Exchange (symbol:K) and the New York Stock Exchange (symbol:KGC).
Media Contact
Victoria Barrington
Senior Director, Corporate Communications
phone: 647-788-4153
victoria.barrington@kinross.com
Investor Relations Contact
Chris Lichtenheldt
Vice-President, Investor Relations
phone: 416-365-2761
chris.lichtenheldt@kinross.com
Review of operations
| |
|
|
|
|
|
|
|
Three months ended March 31,
(unaudited)
|
Gold equivalent ounces
|
|
|
|
|
|
|
| |
Produced
|
|
Sold
|
|
Production cost of
sales ($millions)
|
|
Production cost of
sales/equivalent ounce sold
|
| |
2023
|
2022 |
|
2023
|
2022 |
|
2023 |
2022 |
|
2023
|
2022 |
| |
|
|
|
|
|
|
|
|
|
|
|
| Fort Knox |
65,387
|
54,803 |
|
65,404
|
52,813 |
|
$
|
77.6
|
$ |
67.4 |
|
$
|
1,186
|
$ |
1,276 |
| Round Mountain |
58,832
|
45,319 |
|
58,226
|
46,959 |
|
|
96.5
|
|
52.3 |
|
|
1,657
|
|
1,114 |
| Bald Mountain |
33,828
|
36,071 |
|
47,283
|
41,017 |
|
|
58.0
|
|
40.3 |
|
|
1,227
|
|
983 |
|
United States Total
|
158,047
|
136,193 |
|
170,913
|
140,789 |
|
|
232.1
|
|
160.0 |
|
|
1,358
|
|
1,136 |
| |
|
|
|
|
|
|
|
|
|
|
|
| Paracatu |
123,334
|
108,009 |
|
128,344
|
101,886 |
|
|
118.0
|
|
106.6 |
|
|
919
|
|
1,046 |
| La Coipa |
53,596
|
524 |
|
61,780
|
- |
|
|
44.9
|
|
- |
|
|
727
|
|
- |
| Maricunga |
-
|
- |
|
814
|
858 |
|
|
0.5
|
|
0.7 |
|
|
614
|
|
816 |
| Tasiast |
131,045
|
133,695 |
|
128,479
|
130,195 |
|
|
88.4
|
|
95.8 |
|
|
688
|
|
736 |
| |
|
|
|
|
|
|
|
|
|
|
|
|
Continuing Operations Total
|
466,022
|
378,421 |
|
490,330
|
373,728 |
|
|
483.9
|
|
363.1 |
|
|
987
|
|
972 |
|
|
|
|
|
|
|
|
|
|
|
|
|
|
Discontinued Operations
|
|
|
|
|
|
|
|
|
|
|
|
| Kupol |
-
|
95,891 |
|
-
|
85,937 |
|
|
-
|
|
65.4 |
|
$
|
-
|
$ |
761 |
| Chirano (100%) |
-
|
34,929 |
|
-
|
35,810 |
|
|
-
|
|
47.6 |
|
|
-
|
|
1,329 |
| |
-
|
130,820 |
|
-
|
121,747 |
|
|
-
|
|
113.0 |
|
|
|
|
|
|
|
|
|
|
|
|
|
|
|
|
Interim condensed consolidated balance sheets
|
(unaudited, expressed in millions of U.S. dollars, except share amounts)
|
|
|
|
|
| |
|
|
|
|
| |
|
As at
|
| |
|
March 31,
|
|
December 31, |
| |
|
|
2023
|
|
|
|
2022 |
|
| |
|
|
|
|
|
Assets
|
|
|
|
|
| Current assets |
|
|
|
|
| Cash and cash equivalents |
|
$
|
471.0
|
|
|
$ |
418.1 |
|
| Restricted cash |
|
|
10.9
|
|
|
|
10.1 |
|
| Accounts receivable and other assets |
|
|
290.5
|
|
|
|
318.2 |
|
| Current income tax recoverable |
|
|
6.5
|
|
|
|
8.5 |
|
| Inventories |
|
|
1,138.9
|
|
|
|
1,072.2 |
|
| Unrealized fair value of derivative assets |
|
|
23.0
|
|
|
|
25.5 |
|
| |
|
|
1,940.8
|
|
|
|
1,852.6 |
|
| Non-current assets |
|
|
|
|
| Property, plant and equipment |
|
|
7,793.1
|
|
|
|
7,741.4 |
|
| Long-term investments |
|
|
100.2
|
|
|
|
116.9 |
|
| Other long-term assets |
|
|
660.8
|
|
|
|
680.9 |
|
| Deferred tax assets |
|
|
5.5
|
|
|
|
4.6 |
|
|
Total assets
|
|
$
|
10,500.4
|
|
|
$ |
10,396.4 |
|
|
|
|
|
|
|
|
Liabilities
|
|
|
|
|
| Current liabilities |
|
|
|
|
| Accounts payable and accrued liabilities |
|
$
|
479.3
|
|
|
$ |
550.0 |
|
| Current income tax payable |
|
|
44.6
|
|
|
|
89.4 |
|
| Current portion of long-term debt and credit facilities |
|
|
535.3
|
|
|
|
36.0 |
|
| Current portion of provisions |
|
|
50.8
|
|
|
|
50.8 |
|
| Other current liabilities |
|
|
16.4
|
|
|
|
25.3 |
|
| |
|
|
1,126.4
|
|
|
|
751.5 |
|
| Non-current liabilities |
|
|
|
|
| Long-term debt and credit facilities |
|
|
2,158.9
|
|
|
|
2,556.9 |
|
| Provisions |
|
|
799.1
|
|
|
|
755.9 |
|
| Long-term lease liabilities |
|
|
24.0
|
|
|
|
23.1 |
|
| Other long-term liabilities |
|
|
125.0
|
|
|
|
125.3 |
|
| Deferred tax liabilities |
|
|
311.2
|
|
|
|
301.5 |
|
|
Total liabilities
|
|
$
|
4,544.6
|
|
|
$ |
4,514.2 |
|
|
|
|
|
|
|
|
Equity
|
|
|
|
|
| Common shareholders’ equity |
|
|
|
|
| Common share capital |
|
$
|
4,480.2
|
|
|
$ |
4,449.5 |
|
| Contributed surplus |
|
|
10,641.1
|
|
|
|
10,667.5 |
|
| Accumulated deficit |
|
|
(9,198.2
|
)
|
|
|
(9,251.6 |
) |
| Accumulated other comprehensive income (loss) |
|
|
(36.1
|
)
|
|
|
(41.7 |
) |
|
Total common shareholders’ equity
|
|
|
5,887.0
|
|
|
|
5,823.7 |
|
| Non-controlling interests |
|
|
68.8
|
|
|
|
58.5 |
|
|
Total equity
|
|
|
5,955.8
|
|
|
|
5,882.2 |
|
|
Total liabilities and equity
|
|
$
|
10,500.4
|
|
|
$ |
10,396.4 |
|
|
|
|
|
|
|
|
Common shares
|
|
|
|
|
|
Authorized
|
|
Unlimited
|
|
|
Unlimited |
|
|
Issued and outstanding
|
|
|
1,227,563,020
|
|
|
|
1,221,891,341 |
|
| |
|
|
|
|
|
|
|
|
| |
|
|
|
|
Interim condensed consolidated statements of operations
|
(unaudited, expressed in millions of U.S. dollars, except share and per share amounts)
|
| |
|
Three months ended
|
| |
|
March 31,
|
|
March 31, |
| |
|
|
2023
|
|
|
|
2022 |
|
|
Revenue
|
|
|
|
|
| Metal sales |
|
$
|
929.3
|
|
|
$ |
700.9 |
|
| |
|
|
|
|
|
Cost of sales
|
|
|
|
|
| Production cost of sales |
|
|
483.9
|
|
|
|
363.1 |
|
| Depreciation, depletion and amortization |
|
|
211.9
|
|
|
|
166.5 |
|
|
Total cost of sales
|
|
|
695.8
|
|
|
|
529.6 |
|
|
Gross profit
|
|
|
233.5
|
|
|
|
171.3 |
|
| Other operating expense |
|
|
31.2
|
|
|
|
15.2 |
|
| Exploration and business development |
|
|
34.0
|
|
|
|
23.4 |
|
| General and administrative |
|
|
24.4
|
|
|
|
30.2 |
|
|
Operating earnings
|
|
|
143.9
|
|
|
|
102.5 |
|
| Other income (expense) - net |
|
|
4.4
|
|
|
|
(6.7 |
) |
| Finance income |
|
|
9.4
|
|
|
|
2.2 |
|
| Finance expense |
|
|
(27.5
|
)
|
|
|
(21.2 |
) |
|
Earnings from continuing operations before tax
|
|
|
130.2
|
|
|
|
76.8 |
|
| Income tax (expense) recovery - net |
|
|
(39.8
|
)
|
|
|
4.5 |
|
| Earnings from continuing operations after tax |
|
|
90.4
|
|
|
|
81.3 |
|
| Earnings (loss) from discontinued operations after tax |
|
|
-
|
|
|
|
(605.2 |
) |
|
Net earnings (loss)
|
|
$
|
90.4
|
|
|
$ |
(523.9 |
) |
|
Net earnings from continuing operations attributable to:
|
|
|
|
|
| Non-controlling interests |
|
$
|
0.2
|
|
|
$ |
- |
|
| Common shareholders |
|
$
|
90.2
|
|
|
$ |
81.3 |
|
|
Net earnings (loss) from discontinued operations attributable to:
|
|
|
|
|
| Non-controlling interests |
|
$
|
-
|
|
|
$ |
(0.1 |
) |
| Common shareholders |
|
$
|
-
|
|
|
$ |
(605.1 |
) |
|
Net earnings (loss) attributable to:
|
|
|
|
|
| Non-controlling interests |
|
$
|
0.2
|
|
|
$ |
(0.1 |
) |
| Common shareholders |
|
$
|
90.2
|
|
|
$ |
(523.8 |
) |
|
Earnings per share from continuing operations attributable to common shareholders
|
|
|
|
|
| Basic |
|
$
|
0.07
|
|
|
$ |
0.06 |
|
| Diluted |
|
$
|
0.07
|
|
|
$ |
0.06 |
|
|
Earnings (loss) per share from discontinued operations attributable to common shareholders
|
|
$
|
-
|
|
|
$ |
(0.48 |
) |
| Basic |
|
$
|
-
|
|
|
$ |
(0.48 |
) |
| Diluted |
|
|
|
|
|
Earnings (loss) per share attributable to common shareholders
|
|
|
|
|
| Basic |
|
$
|
0.07
|
|
|
$ |
(0.41 |
) |
| Diluted |
|
$
|
0.07
|
|
|
$ |
(0.41 |
) |
| |
|
|
|
|
Interim condensed consolidated statements of cash flows
|
(unaudited, expressed in millions of U.S. dollars)
|
|
|
|
|
|
| |
|
|
Three months ended
|
| |
|
|
March 31,
|
|
March 31, |
| |
|
|
|
2023
|
|
|
|
2022 |
|
|
Net inflow (outflow) of cash related to the following activities:
|
|
|
|
|
|
|
Operating:
|
|
|
|
|
|
| Earnings from continuing operations after tax |
|
|
$
|
90.4
|
|
|
$ |
81.3 |
|
| Adjustments to reconcile net earnings from continuing operations to net cash provided from operating activities: |
|
|
|
|
|
| Depreciation, depletion and amortization |
|
|
|
211.9
|
|
|
|
166.5 |
|
| Finance expense |
|
|
|
27.5
|
|
|
|
21.2 |
|
| Deferred tax expense (recovery) |
|
|
|
9.0
|
|
|
|
(16.9 |
) |
| Foreign exchange losses and other |
|
|
|
15.4
|
|
|
|
6.8 |
|
| Reclamation expense (recovery) |
|
|
|
4.0
|
|
|
|
(9.8 |
) |
| Changes in operating assets and liabilities: |
|
|
|
|
|
| Accounts receivable and other assets |
|
|
|
20.0
|
|
|
|
48.3 |
|
| Inventories |
|
|
|
(43.2
|
)
|
|
|
(89.3 |
) |
| Accounts payable and accrued liabilities |
|
|
|
(5.8
|
)
|
|
|
(27.8 |
) |
|
Cash flow provided from operating activities
|
|
|
|
329.2
|
|
|
|
180.3 |
|
| Income taxes paid |
|
|
|
(70.2
|
)
|
|
|
(82.4 |
) |
|
Net cash flow of continuing operations provided from operating activities
|
|
|
|
259.0
|
|
|
|
97.9 |
|
|
Net cash flow of discontinued operations provided from operating activities
|
|
|
|
-
|
|
|
|
98.4 |
|
|
Investing:
|
|
|
|
|
|
| Additions to property, plant and equipment |
|
|
|
(221.2
|
)
|
|
|
(100.7 |
) |
| Interest paid capitalized to property, plant and equipment |
|
|
|
(38.3
|
)
|
|
|
(10.6 |
) |
| Acquisitions net of cash acquired |
|
|
|
-
|
|
|
|
(1,027.5 |
) |
| Net disposals (additions) to long-term investments and other assets |
|
|
|
15.3
|
|
|
|
(13.9 |
) |
| Increase in restricted cash - net |
|
|
|
(0.8
|
)
|
|
|
(1.7 |
) |
| Interest received and other - net |
|
|
|
2.7
|
|
|
|
1.1 |
|
|
Net cash flow of continuing operations used in investing activities
|
|
|
|
(242.3
|
)
|
|
|
(1,153.3 |
) |
|
Net cash flow of discontinued operations provided from (used in) investing activities
|
|
|
|
5.0
|
|
|
|
(17.0 |
) |
|
Financing:
|
|
|
|
|
|
| Proceeds from drawdown of debt |
|
|
|
100.0
|
|
|
|
1,097.6 |
|
| Interest paid |
|
|
|
(24.2
|
)
|
|
|
(24.7 |
) |
| Payment of lease liabilities |
|
|
|
(15.5
|
)
|
|
|
(5.4 |
) |
| Dividends paid to common shareholders |
|
|
|
(36.8
|
)
|
|
|
(38.9 |
) |
| Other - net |
|
|
|
7.2
|
|
|
|
5.9 |
|
|
Net cash flow of continuing operations provided from financing activities
|
|
|
|
30.7
|
|
|
|
1,034.5 |
|
|
Net cash flow of discontinued operations provided from financing activities
|
|
|
|
-
|
|
|
|
- |
|
|
Effect of exchange rate changes on cash and cash equivalents of continuing operations
|
|
|
|
0.5
|
|
|
|
- |
|
|
Effect of exchange rate changes on cash and cash equivalents of discontinued operations
|
|
|
|
-
|
|
|
|
(3.8 |
) |
|
Increase in cash and cash equivalents
|
|
|
|
52.9
|
|
|
|
56.7 |
|
|
Cash and cash equivalents, beginning of period
|
|
|
|
418.1
|
|
|
|
531.5 |
|
|
Reclassified to assets held for sale
|
|
|
|
-
|
|
|
|
(134.0 |
) |
|
Cash and cash equivalents, end of period
|
|
|
$
|
471.0
|
|
|
$ |
454.2 |
|
| |
|
|
|
|
|
Operating Summary
|
|
|
Mine
|
Period
|
Tonnes Ore Mined
|
Ore
Processed (Milled)
|
Ore
Processed (Heap Leach)
|
Grade (Mill)
|
Grade (Heap Leach)
|
Recovery (a)(d)
|
Gold Eq Production(b)
|
Gold Eq Sales(b)
|
Production cost of sales
|
Production cost of sales/oz(c)
|
Cap Ex - sustaining(e)
|
Total Cap Ex (e)
|
DD&A
|
| |
|
|
(’000 tonnes) |
(’000 tonnes) |
(’000 tonnes) |
(g/t) |
(g/t) |
(%) |
(ounces) |
(ounces) |
($ millions) |
($/ounce) |
($ millions) |
($ millions) |
($ millions) |
|
Americas
|
Fort Knox
|
Q1 2023
|
7,412
|
1,966
|
5,972
|
0.78
|
0.22
|
82
|
%
|
65,387
|
65,404
|
$
|
77.6
|
$
|
1,186
|
$
|
38.6
|
$
|
39.1
|
$
|
18.6
|
| Q4 2022 |
12,205 |
2,395 |
11,454 |
0.69 |
0.20 |
79 |
% |
83,739 |
87,061 |
$ |
102.1 |
$ |
1,173 |
$ |
34.4 |
$ |
39.1 |
$ |
40.9 |
| Q3 2022 |
15,547 |
2,477 |
13,120 |
0.71 |
0.21 |
80 |
% |
75,522 |
74,221 |
$ |
88.6 |
$ |
1,194 |
$ |
30.5 |
$ |
31.0 |
$ |
21.8 |
| Q2 2022 |
14,591 |
2,260 |
12,785 |
0.72 |
0.19 |
81 |
% |
77,184 |
77,698 |
$ |
92.6 |
$ |
1,192 |
$ |
12.1 |
$ |
13.1 |
$ |
26.1 |
| Q1 2022 |
13,743 |
1,852 |
13,010 |
0.66 |
0.17 |
80 |
% |
54,803 |
52,813 |
$ |
67.4 |
$ |
1,276 |
$ |
1.7 |
$ |
2.9 |
$ |
20.9 |
|
Round Mountain
|
Q1 2023
|
5,019
|
878
|
4,367
|
0.81
|
0.44
|
79
|
%
|
58,832
|
58,226
|
$
|
96.5
|
$
|
1,657
|
$
|
7.4
|
$
|
7.4
|
$
|
34.6
|
| Q4 2022 |
5,177 |
962 |
4,772 |
0.74 |
0.36 |
74 |
% |
61,929 |
67,484 |
$ |
95.1 |
$ |
1,409 |
$ |
41.1 |
$ |
41.1 |
$ |
19.1 |
| Q3 2022 |
8,856 |
1,021 |
8,336 |
0.64 |
0.27 |
79 |
% |
62,417 |
61,757 |
$ |
87.0 |
$ |
1,409 |
$ |
24.7 |
$ |
24.7 |
$ |
17.6 |
| Q2 2022 |
6,702 |
945 |
6,515 |
0.67 |
0.32 |
78 |
% |
56,709 |
51,455 |
$ |
74.8 |
$ |
1,454 |
$ |
20.5 |
$ |
20.6 |
$ |
11.7 |
| Q1 2022 |
3,767 |
929 |
3,208 |
0.80 |
0.36 |
79 |
% |
45,319 |
46,959 |
$ |
52.3 |
$ |
1,114 |
$ |
15.9 |
$ |
16.0 |
$ |
12.1 |
|
Bald Mountain
|
Q1 2023
|
1,864
|
-
|
1,857
|
-
|
0.47
|
nm
|
33,828
|
47,283
|
$
|
58.0
|
$
|
1,227
|
$
|
6.1
|
$
|
25.2
|
$
|
33.9
|
| Q4 2022 |
3,002 |
- |
2,957 |
- |
0.37 |
nm |
58,521 |
66,847 |
$ |
62.8 |
$ |
939 |
$ |
17.2 |
$ |
37.4 |
$ |
63.4 |
| Q3 2022 |
4,152 |
- |
4,152 |
- |
0.37 |
nm |
65,394 |
52,472 |
$ |
51.2 |
$ |
976 |
$ |
10.4 |
$ |
28.2 |
$ |
39.1 |
| Q2 2022 |
4,945 |
- |
4,945 |
- |
0.60 |
nm |
54,108 |
54,472 |
$ |
54.5 |
$ |
1,001 |
$ |
5.0 |
$ |
16.2 |
$ |
38.4 |
| Q1 2022 |
3,870 |
- |
3,870 |
- |
0.63 |
nm |
36,071 |
41,017 |
$ |
40.3 |
$ |
983 |
$ |
2.7 |
$ |
5.8 |
$ |
35.1 |
|
Paracatu
|
Q1 2023
|
8,056
|
15,130
|
-
|
0.37
|
-
|
79
|
%
|
123,334
|
128,344
|
$
|
118.0
|
$
|
919
|
$
|
27.8
|
$
|
27.8
|
$
|
40.4
|
| Q4 2022 |
13,324 |
13,847 |
- |
0.50 |
- |
81 |
% |
180,809 |
183,190 |
$ |
130.3 |
$ |
711 |
$ |
43.9 |
$ |
43.9 |
$ |
52.7 |
| Q3 2022 |
11,752 |
13,797 |
- |
0.45 |
- |
79 |
% |
159,113 |
152,616 |
$ |
131.1 |
$ |
859 |
$ |
33.6 |
$ |
33.6 |
$ |
47.2 |
| Q2 2022 |
11,011 |
15,133 |
- |
0.35 |
- |
75 |
% |
129,423 |
133,472 |
$ |
129.6 |
$ |
971 |
$ |
31.2 |
$ |
31.2 |
$ |
46.0 |
| Q1 2022 |
6,165 |
13,645 |
- |
0.33 |
- |
75 |
% |
108,009 |
101,886 |
$ |
106.6 |
$ |
1,046 |
$ |
16.0 |
$ |
16.0 |
$ |
39.6 |
|
La Coipa(f)
|
Q1 2023
|
748
|
691
|
-
|
1.68
|
-
|
88
|
%
|
53,596
|
61,780
|
$
|
44.9
|
$
|
727
|
$
|
1.6
|
$
|
25.4
|
$
|
36.4
|
| Q4 2022 |
1,047 |
933 |
- |
1.47 |
- |
84 |
% |
67,683 |
68,135 |
$ |
39.4 |
$ |
578 |
$ |
2.6 |
$ |
46.0 |
$ |
25.6 |
| Q3 2022 |
1,079 |
637 |
- |
1.19 |
- |
83 |
% |
33,955 |
24,681 |
$ |
12.1 |
$ |
490 |
$ |
2.9 |
$ |
34.7 |
$ |
- |
| Q2 2022 |
550 |
321 |
- |
0.74 |
- |
69 |
% |
7,414 |
7,099 |
$ |
5.6 |
$ |
789 |
$ |
1.6 |
$ |
39.0 |
$ |
- |
| Q1 2022 |
174 |
58 |
- |
0.41 |
- |
82 |
% |
524 |
- |
$ |
- |
$ |
- |
$ |
0.7 |
$ |
35.8 |
$ |
- |
|
West Africa
|
Tasiast
|
Q1 2023
|
1,690
|
1,208
|
-
|
3.49
|
-
|
91
|
%
|
131,045
|
128,479
|
$
|
88.4
|
$
|
688
|
$
|
14.6
|
$
|
64.6
|
$
|
46.2
|
| Q4 2022 |
3,737 |
1,627 |
- |
3.21 |
- |
90 |
% |
143,002 |
147,019 |
$ |
96.2 |
$ |
654 |
$ |
38.3 |
$ |
90.3 |
$ |
48.7 |
| Q3 2022 |
4,437 |
1,741 |
- |
2.72 |
- |
89 |
% |
132,754 |
128,014 |
$ |
94.8 |
$ |
741 |
$ |
3.6 |
$ |
33.4 |
$ |
58.0 |
| Q2 2022 |
3,053 |
1,680 |
- |
2.51 |
- |
89 |
% |
129,140 |
114,064 |
$ |
93.3 |
$ |
818 |
$ |
6.7 |
$ |
24.3 |
$ |
56.4 |
| Q1 2022 |
3,462 |
1,524 |
- |
2.54 |
- |
94 |
% |
133,695 |
130,195 |
$ |
95.8 |
$ |
736 |
$ |
4.1 |
$ |
19.4 |
$ |
57.1 |
|
(a)
|
Due to the nature of heap leach operations, recovery rates at Bald Mountain cannot be accurately measured on a quarterly basis. Recovery rates at Fort Knox and Round Mountain represent mill recovery only.
|
|
(b)
|
Gold equivalent ounces include silver ounces produced and sold converted to a gold equivalent based on the ratio of the average spot market prices for the commodities for each period. The ratios for the quarters presented are as follows: Q1 2023: 83.82:1; Q4 2022: 81.88:1; Q3 2022: 89.91:1; Q2 2022: 82.77:1; Q1 2022: 78.19:1.
|
|
(c)
|
“Production cost of sales per equivalent ounce sold” is defined as production cost of sales divided by total gold equivalent ounces sold from continuing operations.
|
|
(d)
|
“nm” means not meaningful.
|
|
(e)
|
“Total Cap Ex” is as reported as “Additions to property, plant and equipment” on the interim condensed consolidated statements of cash flows. “Capital expenditures - sustaining” is a non-GAAP financial measure. The definition and reconciliation of this non-GAAP financial measure is included on page 22 of this news release.
|
|
(f)
|
La Coipa silver grade and recovery were as follows: Q1 2023: 125.77 g/t, 70%; Q4 2022: 137.53 g/t, 68%; Q3 2022: 121.06 g/t, 61%; Q2 2022: 56.04 g/t, 43%; Q1 2022: nm.
|
| |
|
Reconciliation of non-GAAP financial measures and ratios
The Company has included certain non-GAAP financial measures and ratios in this document. These financial measures and ratios are not defined under International Financial Reporting Standards (IFRS) and should not be considered in isolation. The Company believes that these financial measures and ratios, together with financial measures and ratios determined in accordance with IFRS, provide investors with an improved ability to evaluate the underlying performance of the Company. The inclusion of these financial measures and ratios is meant to provide additional information and should not be used as a substitute for performance measures prepared in accordance with IFRS. These financial measures and ratios are not necessarily standard and therefore may not be comparable to other issuers.
All the non-GAAP financial measures and ratios in this document are from continuing operations and exclude results from the Company’s Chirano and Russian operations due to the classification of these operations as discontinued. The comparative information as previously presented in the MD&A and financial statements for the three months ended March 31, 2022, has been recast to exclude Chirano. As a result of the exclusion of Chirano, the following non-GAAP financial measures and ratios are no longer on an attributable basis, but on a total basis: production cost of sales from continuing operations per ounce sold on a by-product basis and all-in-sustaining cost from continuing operations per equivalent ounce sold and per ounce sold on a by-product basis.
Adjusted net earnings from continuing operations attributable to common shareholders and adjusted net earnings from continuing operations per share are non-GAAP financial measures and ratios which determine the performance of the Company, excluding certain impacts which the Company believes are not reflective of the Company’s underlying performance for the reporting period, such as the impact of foreign exchange gains and losses, reassessment of prior year taxes and/or taxes otherwise not related to the current period, impairment charges (reversals), gains and losses and other one-time costs related to acquisitions, dispositions and other transactions, and non-hedge derivative gains and losses. Although some of the items are recurring, the Company believes that they are not reflective of the underlying operating performance of its current business and are not necessarily indicative of future operating results. Management believes that these measures and ratios, which are used internally to assess performance and in planning and forecasting future operating results, provide investors with the ability to better evaluate underlying performance, particularly since the excluded items are typically not included in public guidance. However, adjusted net earnings from continuing operations and adjusted net earnings from continuing operations per share measures and ratios are not necessarily indicative of net earnings from continuing operations and earnings per share measures and ratios as determined under IFRS.
The following table provides a reconciliation of net earnings from continuing operations to adjusted net earnings from continuing operations for the periods presented:
| |
|
(unaudited, expressed in millions of U.S dollars,
|
Three Months Ended
|
|
except per share amounts)
|
March 31,
|
| |
|
2023
|
|
|
2022 |
|
| |
|
|
| Net earnings from continuing operations attributable to common shareholders - as reported |
$
|
90.2
|
|
$ |
81.3 |
|
| Adjusting items: |
|
|
| Foreign exchange (gains) losses |
|
(3.8
|
)
|
|
4.1 |
|
| Foreign exchange gains on translation of tax basis and foreign exchange on deferred income taxes within income tax expense |
|
(13.2
|
)
|
|
(15.7 |
) |
| Taxes in respect of prior periods |
|
12.0
|
|
|
5.7 |
|
| Reclamation expense (recovery) |
|
4.0
|
|
|
(9.8 |
) |
| Other(a) |
|
(1.2
|
)
|
|
3.5 |
|
| Tax effects of the above adjustments |
|
(0.4
|
)
|
|
(0.3 |
) |
| |
|
(2.6
|
)
|
|
(12.5 |
) |
| Adjusted net earnings from continuing operations attributable to common shareholders |
$
|
87.6
|
|
$ |
68.8 |
|
| Weighted average number of common shares outstanding - Basic |
|
1,225.0
|
|
|
1,264.5 |
|
| Adjusted net earnings from continuing operations per share |
$
|
0.07
|
|
$ |
0.05 |
|
| Basic earnings from continuing operations per share attributable to common shareholders - as reported |
$
|
0.07
|
|
$ |
0.06 |
|
| |
|
|
|
(a)
|
Other includes various impacts, such as one-time costs at sites, and gains and losses on the sale of assets and hedges, which the Company believes are not reflective of the Company’s underlying performance for the reporting period.
|
| |
|
Free cash flow from continuing operations is a non-GAAP financial measure and is defined as net cash flow of continuing operations provided from operating activities less additions to property, plant and equipment. The Company believes that this measure, which is used internally to evaluate the Company’s underlying cash generation performance and the ability to repay creditors and return cash to shareholders, provides investors with the ability to better evaluate the Company’s underlying performance. However, the free cash flow from continuing operations measure is not necessarily indicative of operating earnings or net cash flow of continuing operations provided from operating activities as determined under IFRS.
The following table provides a reconciliation of free cash flow from continuing operations for the periods presented:
| |
|
|
|
| |
|
Three months ended
|
|
(unaudited, expressed in millions of U.S dollars)
|
|
March 31,
|
| |
|
|
2023
|
|
|
2022 |
|
| |
|
|
|
| Net cash flow of continuing operations provided from operating activities - as reported |
$
|
259.0
|
|
$ |
97.9 |
|
| |
|
|
|
| Less: Additions to property, plant and equipment |
|
(221.2
|
)
|
|
(100.7 |
) |
| |
|
|
|
| Free cash flow from continuing operations |
$
|
37.8
|
|
$ |
(2.8 |
) |
| |
|
|
|
| |
|
|
|
Adjusted operating cash flow from continuing operations is a non-GAAP financial measure and is defined as net cash flow of continuing operations provided from operating activities excluding certain impacts which the Company believes are not reflective of the Company’s regular operating cash flow and excluding changes in working capital. Working capital can be volatile due to numerous factors, including the timing of tax payments. The Company uses adjusted operating cash flow from continuing operations internally as a measure of the underlying operating cash flow performance and future operating cash flow-generating capability of the Company. However, the adjusted operating cash flow from continuing operations measure is not necessarily indicative of net cash flow of continuing operations provided from operating activities as determined under IFRS.
The following table provides a reconciliation of adjusted operating cash flow from continuing operations for the periods presented:
| |
|
|
| |
Three months ended
|
|
(unaudited, expressed in millions of U.S dollars)
|
March 31,
|
| |
|
2023
|
|
|
2022 |
|
| |
|
|
| Net cash flow of continuing operations provided from operating activities - as reported |
$
|
259.0
|
|
$ |
97.9 |
|
| |
|
|
| Adjusting items: |
|
|
| Working capital changes: |
|
|
| Accounts receivable and other assets |
|
(20.0
|
)
|
|
(48.3 |
) |
| Inventories |
|
43.2
|
|
|
89.3 |
|
| Accounts payable and other liabilities, including income taxes paid |
|
76.0
|
|
|
110.2 |
|
| Total working capital changes |
|
99.2
|
|
|
151.2 |
|
| Adjusted operating cash flow from continuing operations |
$
|
358.2
|
|
$ |
249.1 |
|
| |
|
|
| |
|
|
Production cost of sales from continuing operations per ounce sold on a by-product basis is a non-GAAP ratio which calculates the Company’s non-gold production as a credit against its per ounce production costs, rather than converting its non-gold production into gold equivalent ounces and crediting it to total production, as is the case in co-product accounting. Management believes that this ratio provides investors with the ability to better evaluate Kinross’ production cost of sales per ounce on a comparable basis with other major gold producers who routinely calculate their cost of sales per ounce using by-product accounting rather than co-product accounting.
The following table provides a reconciliation of production cost of sales from continuing operations per ounce sold on a by-product basis for the periods presented:
| |
|
|
(unaudited, expressed in millions of U.S. dollars,
|
|
Three months ended
|
|
except ounces and production cost of sales per equivalent ounce)
|
|
March 31,
|
| |
|
|
2023
|
|
|
2022 |
|
| |
|
|
|
| Production cost of sales from continuing operations - as reported |
$
|
483.9
|
|
$ |
363.1 |
|
| Less: silver revenue(a) |
|
(54.9
|
)
|
|
(4.4 |
) |
| Production cost of sales from continuing operations net of silver by-product revenue |
$
|
429.0
|
|
$ |
358.7 |
|
| |
|
|
|
| Gold ounces sold from continuing operations |
|
461,696
|
|
|
371,335 |
|
| Total gold equivalent ounces sold from continuing operations |
|
490,330
|
|
|
373,728 |
|
| Production cost of sales from continuing operations per equivalent ounce sold(b) |
$
|
987
|
|
$ |
972 |
|
| Production cost of sales from continuing operations per ounce sold on a by-product basis |
$
|
929
|
|
$ |
966 |
|
| |
|
|
|
See Endnotes on page 22 for details of the footnotes referenced within the table above.
All-in sustaining cost and attributable all-in cost from continuing operations per ounce sold on a by-product basis are non-GAAP financial measures and ratios, as applicable, calculated based on guidance published by the World Gold Council (“WGC”). The WGC is a market development organization for the gold industry and is an association whose membership comprises leading gold mining companies including Kinross. Although the WGC is not a mining industry regulatory organization, it worked closely with its member companies to develop these metrics. Adoption of the all-in sustaining cost and all-in cost metrics is voluntary and not necessarily standard, and therefore, these measures and ratios presented by the Company may not be comparable to similar measures and ratios presented by other issuers. The Company believes that the all-in sustaining cost and all-in cost measures complement existing measures and ratios reported by Kinross.
All-in sustaining cost includes both operating and capital costs required to sustain gold production on an ongoing basis. The value of silver sold is deducted from the total production cost of sales as it is considered residual production, i.e. a by-product. Sustaining operating costs represent expenditures incurred at current operations that are considered necessary to maintain current production. Sustaining capital represents capital expenditures at existing operations comprising mine development costs, including capitalized stripping, and ongoing replacement of mine equipment and other capital facilities, and does not include capital expenditures for major growth projects or enhancement capital for significant infrastructure improvements at existing operations.
All-in cost is comprised of all-in sustaining cost as well as operating expenditures incurred at locations with no current operation, or costs related to other non-sustaining activities, and capital expenditures for major growth projects or enhancement capital for significant infrastructure improvements at existing operations.
All-in sustaining cost and attributable all-in cost from continuing operations per ounce sold on a by-product basis are calculated by adjusting production cost of sales from continuing operations, as reported on the interim condensed consolidated statements of operations, as follows:
| |
|
|
(unaudited, expressed in millions of U.S. dollars,
|
Three Months Ended
|
|
except ounces and costs per ounce)
|
March 31,
|
| |
|
2023
|
|
|
2022 |
|
| |
|
|
|
|
|
|
| Production cost of sales from continuing operations - as reported |
$
|
483.9
|
|
$ |
363.1 |
|
| Less: silver revenue from continuing operations(a) |
|
(54.9
|
)
|
|
(4.4 |
) |
| Production cost of sales from continuing operations net of silver by-product revenue |
$
|
429.0
|
|
$ |
358.7 |
|
| Adjusting items: |
|
|
| General and administrative(d) |
|
24.4
|
|
|
30.2 |
|
| Other operating expense - sustaining(e) |
|
6.5
|
|
|
5.6 |
|
| Reclamation and remediation - sustaining(f) |
|
14.3
|
|
|
7.8 |
|
| Exploration and business development - sustaining(g) |
|
6.6
|
|
|
6.9 |
|
| Additions to property, plant and equipment - sustaining(h) |
|
96.6
|
|
|
41.1 |
|
| Lease payments - sustaining(i) |
|
15.2
|
|
|
5.2 |
|
| All-in Sustaining Cost on a by-product basis |
$
|
592.6
|
|
$ |
455.5 |
|
| Adjusting items on an attributable(c) basis: |
|
|
| Other operating expense - non-sustaining(e) |
|
8.7
|
|
|
12.2 |
|
| Reclamation and remediation - non-sustaining(f) |
|
1.9
|
|
|
1.2 |
|
| Exploration and business development - non-sustaining(g) |
|
27.6
|
|
|
16.5 |
|
| Additions to property, plant and equipment - non-sustaining(h) |
|
115.2
|
|
|
58.7 |
|
| Lease payments - non-sustaining(i) |
|
0.3
|
|
|
0.2 |
|
| All-in Cost on a by-product basis - attributable(c) |
$
|
746.3
|
|
$ |
544.3 |
|
| |
|
461,696
|
|
|
371,335 |
|
| Production cost of sales from continuing operations per equivalent ounce sold(b) |
$
|
987
|
|
$ |
972 |
|
| All-in sustaining cost from continuing operations per ounce sold on a by-product basis |
$
|
1,284
|
|
$ |
1,227 |
|
| Attributable(c) all-in cost from continuing operations per ounce sold on a by-product basis |
$
|
1,616
|
|
$ |
1,466 |
|
| |
|
|
See Endnotes on page 22 for details of the footnotes referenced within the table above.
The Company also assesses its all-in sustaining cost and attributable all-in cost from continuing operations on a gold equivalent ounce basis. Under these non-GAAP financial measures and ratios, the Company’s production of silver is converted into gold equivalent ounces and credited to total production.
All-in sustaining cost and attributable all-in cost from continuing operations per equivalent ounce sold are calculated by adjusting production cost of sales from continuing operations, as reported on the interim condensed consolidated statements of operations, as follows:
| |
|
|
|
(unaudited, expressed in millions of U.S. dollars,
|
Three months ended
|
|
except ounces and costs per ounce)
|
March 31,
|
| |
2023
|
2022 |
| |
|
|
| Production cost of sales from continuing operations - as reported |
$
|
483.9
|
$ |
363.1 |
| Adjusting items: |
|
|
| General and administrative(d) |
|
24.4
|
|
30.2 |
| Other operating expense - sustaining(e) |
|
6.5
|
|
5.6 |
| Reclamation and remediation - sustaining(f) |
|
14.3
|
|
7.8 |
| Exploration and business development - sustaining(g) |
|
6.6
|
|
6.9 |
| Additions to property, plant and equipment - sustaining(h) |
|
96.6
|
|
41.1 |
| Lease payments - sustaining(i) |
|
15.2
|
|
5.2 |
| All-in Sustaining Cost |
$
|
647.5
|
$ |
459.9 |
| Adjusting items on an attributable(c) basis: |
|
|
| Other operating expense - non-sustaining(e) |
|
8.7
|
|
12.2 |
| Reclamation and remediation - non-sustaining(f) |
|
1.9
|
|
1.2 |
| Exploration and business development - non-sustaining(g) |
|
27.6
|
|
16.5 |
| Additions to property, plant and equipment - non-sustaining(h) |
|
115.2
|
|
58.7 |
| Lease payments - non-sustaining(i) |
|
0.3
|
|
0.2 |
| All-in Cost - attributable(c) |
$
|
801.2
|
$ |
548.7 |
| Gold equivalent ounces sold from continuing operations |
|
490,330
|
|
373,728 |
| Production cost of sales from continuing operations per equivalent ounce sold(b) |
$
|
987
|
$ |
972 |
| All-in sustaining cost from continuing operations per equivalent ounce sold |
$
|
1,321
|
$ |
1,231 |
| Attributable(c) all-in cost from continuing operations per equivalent ounce sold |
$
|
1,634
|
$ |
1,468 |
| |
|
|
See Endnotes on page 22 for details of the footnotes referenced within the table above.
Capital expenditures from continuing operations are classified as either sustaining capital expenditures or non-sustaining capital expenditures, depending on the nature of the expenditure. Sustaining capital expenditures typically represent capital expenditures at existing operations including capitalized exploration costs and capitalized stripping unless related to major projects, ongoing replacement of mine equipment and other capital facilities and other capital expenditures and is calculated as total additions to property, plant and equipment (as reported on the interim condensed consolidated statements of cash flows), less non-sustaining capital expenditures. Non-sustaining capital expenditures represent capital expenditures for major projects, including major capital stripping projects at existing operations that are expected to materially benefit the operation, as well as enhancement capital for significant infrastructure improvements at existing operations. Management believes this to be a useful indicator of the purpose of capital expenditures and this distinction is an input into the calculation of all-in sustaining costs from continuing operations per ounce and attributable all-in costs from continuing operations per ounce. The categorization of sustaining capital expenditures and non-sustaining capital expenditures is consistent with the definitions under the WGC all-in cost standard. Sustaining capital expenditures and non-sustaining capital expenditures are not defined under IFRS, however, the sum of these two measures total to additions to property, plant and equipment as disclosed under IFRS on the interim condensed consolidated statements of cash flows.
The following table provides a reconciliation of the classification of capital expenditures for the periods presented:
|
(unaudited, expressed in millions of U.S dollars)
|
|
|
|
|
|
|
|
| Three months ended March 31, 2023: |
Fort Knox (USA)
|
Round Mountain (USA)
|
Bald Mountain (USA)
|
Manh Choh (USA)(a)
|
Total USA
|
Paracatu (Brazil)
|
La Coipa (Chile)
|
Tasiast (Mauritania)
|
|
Other(b)
|
Total
|
| Sustaining capital expenditures |
$
|
38.6
|
$
|
7.4
|
$
|
6.1
|
$
|
-
|
$
|
52.1
|
$
|
27.8
|
$
|
1.6
|
$
|
14.6
|
|
$
|
0.4
|
$
|
96.5
|
| Non-sustaining capital expenditures |
|
0.5
|
|
-
|
|
19.1
|
|
28.7
|
|
48.3
|
|
-
|
|
23.8
|
|
50.0
|
|
|
2.6
|
|
124.7
|
| Additions to property, plant and equipment - per cash flow |
$
|
39.1
|
$
|
7.4
|
$
|
25.2
|
$
|
28.7
|
$
|
100.4
|
$
|
27.8
|
$
|
25.4
|
$
|
64.6
|
|
$
|
3.0
|
$
|
221.2
|
| |
|
|
|
|
|
|
|
|
|
|
|
| Three months ended March 31, 2022:(c) |
| Sustaining capital expenditures |
$ |
1.7 |
$ |
16.0 |
$ |
2.7 |
$ |
- |
$ |
20.4 |
$ |
16.0 |
$ |
0.7 |
$ |
4.1 |
|
$ |
0.2 |
$ |
41.4 |
| Non-sustaining capital expenditures |
|
1.2 |
|
- |
|
3.1 |
|
2.9 |
|
7.2 |
|
- |
|
35.1 |
|
15.3 |
|
|
1.7 |
|
59.3 |
| Additions to property, plant and equipment - per cash flow |
$ |
2.9 |
$ |
16.0 |
$ |
5.8 |
$ |
2.9 |
$ |
27.6 |
$ |
16.0 |
$ |
35.8 |
$ |
19.4 |
|
$ |
1.9 |
$ |
100.7 |
| |
|
|
|
|
|
|
|
|
|
|
|
|
(a)
|
Represents 100% of capital expenditures, of which 70% is Kinross’ share.
|
|
(b)
|
Other includes non-sustaining capital expenditures of $1.2 million in 2023 at Lobo-Marte in Chile and sustaining and non-sustaining capital expenditures of $0.4 million and $1.4 million in 2023, respectively, in Canada.
|
|
(c)
|
Results for the three months ended March 31, 2022 have been updated retrospectively and exclude results from the Company’s Chirano and Russian operations due to the classification of these operations in 2022.
|
| |
|
Endnotes
|
(a)
|
“Silver revenue” represents the portion of metal sales realized from the production of the secondary or by-product metal (i.e. silver). Revenue from the sale of silver, which is produced as a by-product of the process used to produce gold, effectively reduces the cost of gold production.
|
|
(b)
|
“Production cost of sales from continuing operations per equivalent ounce sold” is defined as production cost of sales from continuing operations divided by total gold equivalent ounces sold from continuing operations.
|
|
(c)
|
“Attributable” includes Kinross’ share of Manh Choh (70%) costs. As Manh Choh is a non-operating site, the attributable costs are non-sustaining costs and as such only impact the all-in-cost measures.
|
|
(d)
|
“General and administrative” expenses are as reported on the interim condensed consolidated statements of operations, net of certain restructuring expenses. General and administrative expenses are considered sustaining costs as they are required to be absorbed on a continuing basis for the effective operation and governance of the Company.
|
|
(e)
|
“Other operating expense – sustaining” is calculated as “Other operating expense” as reported on the interim condensed consolidated statements of operations, less other operating and reclamation and remediation expenses related to non-sustaining activities as well as other items not reflective of the underlying operating performance of our business. Other operating expenses are classified as either sustaining or non-sustaining based on the type and location of the expenditure incurred. The majority of other operating expenses that are incurred at existing operations are considered costs necessary to sustain operations, and are therefore classified as sustaining. Other operating expenses incurred at locations where there is no current operation or related to other non-sustaining activities are classified as non-sustaining.
|
|
(f)
|
“Reclamation and remediation - sustaining” is calculated as current period accretion related to reclamation and remediation obligations plus current period amortization of the corresponding reclamation and remediation assets, and is intended to reflect the periodic cost of reclamation and remediation for currently operating mines. Reclamation and remediation costs for development projects or closed mines are excluded from this amount and classified as non-sustaining.
|
|
(g)
|
“Exploration and business development – sustaining” is calculated as “Exploration and business development” expenses as reported on the interim condensed consolidated statements of operations, less non-sustaining exploration and business development expenses. Exploration expenses are classified as either sustaining or non-sustaining based on a determination of the type and location of the exploration expenditure. Exploration expenditures within the footprint of operating mines are considered costs required to sustain current operations and so are included in sustaining costs. Exploration expenditures focused on new ore bodies near existing mines (i.e. brownfield), new exploration projects (i.e. greenfield) or for other generative exploration activity not linked to existing mining operations are classified as non-sustaining. Business development expenses are classified as either sustaining or non-sustaining based on a determination of the type of expense and requirement for general or growth related operations.
|
|
(h)
|
“Additions to property, plant and equipment – sustaining and non-sustaining” are as presented on page 22 of this news release. Non-sustaining capital expenditures included in the calculation of attributable all-in-cost includes Kinross’ share of Manh Choh (70%) costs.
|
|
(i)
|
“Lease payments – sustaining” represents the majority of lease payments as reported on the interim condensed consolidated statements of cash flows and is made up of the principal and financing components of such cash payments, less non-sustaining lease payments. Lease payments for development projects or closed mines are classified as non-sustaining.
|
| |
|
APPENDIX A
Recent LP Fault zone assay results
Hole ID
|
|
From (m)
|
To
(m)
|
Width (m)
|
True
Width (m)
|
Au
(g/t)
|
Target
|
|
BR-539
|
|
645.7 |
649.4 |
3.7 |
2.9 |
0.38 |
Bruma |
|
BR-539
|
and |
719.7 |
724.0 |
4.4 |
3.5 |
0.56 |
|
|
BR-653
|
|
744.5 |
754.4 |
9.9 |
7.2 |
1.03 |
Discovery |
|
BR-653
|
and |
968.1 |
973.7 |
5.6 |
4.8 |
0.58 |
|
|
BR-654
|
|
656.4 |
682.5 |
26.1 |
22.2 |
0.86 |
Discovery |
|
BR-654
|
and |
690.0 |
693.5 |
3.5 |
2.9 |
0.39 |
|
|
BR-654
|
and |
712.8 |
721.2 |
8.5 |
7.1 |
0.83 |
|
|
BR-654
|
and |
736.5 |
742.1 |
5.6 |
4.1 |
0.59 |
|
|
BR-654
|
and |
765.2 |
769.7 |
4.5 |
3.7 |
0.61 |
|
|
BR-654
|
and |
778.7 |
790.7 |
12.0 |
10.2 |
0.59 |
|
|
BR-654
|
and |
798.1 |
816.2 |
18.2 |
15.4 |
1.45 |
|
|
BR-654
|
including |
809.0 |
811.0 |
2.0 |
1.7 |
6.32 |
|
|
BR-654
|
and |
835.7 |
846.3 |
10.6 |
8.0 |
0.59 |
|
|
BR-655
|
|
542.9 |
592.2 |
49.3 |
36.0 |
2.88 |
Discovery |
|
BR-655
|
including |
549.0 |
552.9 |
3.9 |
2.8 |
3.52 |
|
|
BR-655
|
and including |
577.8 |
585.9 |
8.1 |
5.9 |
12.09 |
|
|
BR-655
|
and |
598.3 |
610.0 |
11.7 |
8.7 |
1.11 |
|
|
BR-655
|
and |
628.8 |
632.0 |
3.3 |
2.5 |
0.53 |
|
|
BR-655
|
and |
648.0 |
652.2 |
4.1 |
3.5 |
0.83 |
|
|
BR-655
|
and |
688.5 |
695.5 |
7.0 |
5.2 |
3.44 |
|
|
BR-655
|
including |
688.5 |
693.8 |
5.3 |
3.9 |
3.96 |
|
|
BR-655
|
and |
708.0 |
712.5 |
4.5 |
3.8 |
0.51 |
|
|
BR-656
|
|
270.2 |
274.0 |
3.8 |
3.0 |
0.64 |
Discovery |
|
BR-656
|
and |
417.5 |
436.8 |
19.3 |
17.3 |
1.08 |
|
|
BR-656
|
and |
457.2 |
498.5 |
41.4 |
29.8 |
0.95 |
|
|
BR-656
|
and |
504.6 |
520.0 |
15.4 |
12.6 |
0.71 |
|
|
BR-656
|
and |
546.2 |
556.1 |
10.0 |
7.6 |
0.78 |
|
|
BR-656
|
and |
655.4 |
658.4 |
3.0 |
2.5 |
0.37 |
|
|
BR-659
|
|
519.2 |
527.8 |
8.6 |
6.9 |
0.92 |
Viggo |
|
BR-667
|
|
525.4 |
532.4 |
7.0 |
6.0 |
1.78 |
Discovery |
|
BR-667
|
and |
541.5 |
601.7 |
60.2 |
48.8 |
1.00 |
|
|
BR-697A
|
|
968.8 |
971.8 |
3.0 |
2.8 |
0.46 |
Yuma |
|
BR-697A
|
and |
1,004.2 |
1,046.2 |
42.1 |
38.0 |
5.24 |
|
|
BR-697A
|
including |
1,027.4 |
1,032.0 |
4.7 |
4.2 |
32.35 |
|
|
BR-697A
|
and |
1,044.2 |
1,044.9 |
0.8 |
0.7 |
64.50 |
|
|
BR-669
|
|
412.7 |
416.7 |
4.0 |
3.6 |
0.47 |
Discovery |
|
BR-669
|
and |
421.5 |
427.8 |
6.3 |
4.8 |
0.74 |
|
|
BR-669
|
and |
443.8 |
455.8 |
12.0 |
8.8 |
1.74 |
|
|
BR-669
|
including |
447.3 |
449.4 |
2.1 |
1.6 |
7.55 |
|
|
BR-669
|
and |
554.6 |
561.8 |
7.2 |
5.6 |
1.16 |
|
|
BR-679
|
|
310.5 |
313.5 |
3.0 |
2.4 |
0.70 |
Bruma |
|
BR-679
|
and |
324.3 |
328.2 |
3.8 |
3.2 |
0.56 |
|
|
BR-679
|
and |
472.5 |
475.5 |
3.0 |
2.5 |
1.28 |
|
|
BR-694
|
No significant intersections |
Auro |
|
BR-695
|
|
1,363.8 |
1,373.3 |
9.5 |
8.6 |
2.07 |
Yuma |
|
BR-695
|
including |
1,363.8 |
1,367.4 |
3.6 |
3.3 |
5.02 |
|
|
BR-695
|
|
1,530.0 |
1,551.0 |
21.0 |
19.1 |
1.14 |
|
|
BR-695
|
|
1,556.5 |
1,602.2 |
45.7 |
41.6 |
2.71 |
|
|
BR-695
|
including |
1,556.5 |
1,567.0 |
10.6 |
9.6 |
10.46 |
|
|
BR-695
|
including |
1,561.4 |
1,565.0 |
3.7 |
3.3 |
24.38 |
|
|
BR-695
|
|
1,617.2 |
1,620.0 |
2.8 |
2.5 |
5.31 |
|
|
BR-708A
|
No significant intersections |
Yauro |
|
BR-716
|
|
504.0 |
507.0 |
3.0 |
2.5 |
0.49 |
Bruma |
|
BR-716
|
and |
625.0 |
629.4 |
4.4 |
3.4 |
0.55 |
|
|
BR-716
|
and |
638.8 |
657.5 |
18.7 |
14.5 |
0.87 |
|
|
BR-716
|
and |
665.2 |
672.3 |
7.1 |
5.7 |
0.67 |
|
|
BR-716
|
and |
721.6 |
730.6 |
8.9 |
7.7 |
0.54 |
|
|
BR-717
|
|
572.4 |
581.5 |
9.1 |
6.4 |
1.02 |
Bruma |
|
BR-717
|
and |
631.5 |
639.4 |
7.9 |
7.2 |
0.50 |
|
|
BR-718
|
No significant intersections |
Bruma |
|
BR-719
|
|
620.7 |
627.6 |
6.8 |
5.3 |
0.82 |
Bruma |
|
BR-719
|
and |
680.4 |
706.3 |
25.9 |
19.4 |
2.05 |
|
|
BR-719
|
including |
682.0 |
694.0 |
12.0 |
9.0 |
3.66 |
|
|
BR-720
|
|
220.1 |
225.5 |
5.4 |
4.0 |
0.49 |
Discovery |
|
BR-720
|
and |
242.2 |
264.0 |
21.8 |
18.5 |
0.79 |
|
|
BR-720
|
and |
334.0 |
339.0 |
5.0 |
3.9 |
0.49 |
|
|
BR-720
|
and |
454.5 |
456.5 |
2.0 |
1.4 |
16.69 |
|
|
BR-728
|
No significant intersections |
Bruma |
|
BR-729
|
|
639.1 |
645.0 |
5.9 |
4.8 |
0.64 |
Bruma |
|
BR-732
|
|
48.5 |
57.5 |
9.0 |
7.8 |
0.33 |
Viggo |
|
BR-733
|
No significant intersections |
Viggo |
|
BR-734
|
|
38.5 |
56.4 |
18.0 |
13.1 |
1.33 |
Viggo |
|
BR-735
|
|
120.0 |
123.0 |
3.0 |
2.6 |
73.18 |
Viggo |
|
BR-735
|
including |
121.5 |
123.0 |
1.5 |
1.3 |
146.00 |
|
|
BR-736
|
|
211.7 |
217.0 |
5.3 |
4.8 |
3.17 |
Viggo |
|
BR-736
|
including |
212.7 |
216.0 |
3.3 |
3.0 |
4.57 |
|
|
BR-739
|
|
41.0 |
45.0 |
4.0 |
3.2 |
0.72 |
Viggo |
|
BR-740
|
|
443.0 |
446.0 |
3.0 |
2.6 |
1.26 |
Viggo |
|
BR-741
|
|
505.5 |
510.0 |
4.5 |
4.1 |
0.52 |
Viggo |
|
BR-742
|
|
432.8 |
438.7 |
5.9 |
5.0 |
0.57 |
Viggo |
|
BR-742
|
and |
466.4 |
471.0 |
4.6 |
4.1 |
0.67 |
|
|
BR-743
|
|
466.2 |
482.3 |
16.1 |
13.2 |
0.87 |
Viggo |
|
BR-755
|
No significant intersections |
Auro |
|
BR-756
|
|
988.3 |
994.5 |
6.3 |
5.0 |
0.99 |
Auro |
|
BR-757
|
|
867.0 |
870.0 |
3.0 |
2.2 |
1.17 |
Auro |
|
BR-757
|
and |
892.5 |
897.0 |
4.5 |
3.9 |
0.51 |
|
|
BR-758
|
|
578.8 |
582.0 |
3.2 |
2.2 |
4.04 |
Viggo |
|
BR-759
|
|
664.0 |
667.0 |
3.0 |
2.2 |
0.74 |
Auro |
|
BR-759
|
and |
912.0 |
922.5 |
10.6 |
8.0 |
0.67 |
|
|
BR-762
|
|
517.0 |
520.5 |
3.5 |
2.7 |
2.72 |
Viggo |
|
BR-765
|
|
729.0 |
738.0 |
9.0 |
7.2 |
0.80 |
Auro |
|
BR-765
|
and |
763.8 |
768.0 |
4.3 |
3.4 |
0.58 |
|
|
BR-766
|
|
510.0 |
517.7 |
7.7 |
6.6 |
2.80 |
Viggo |
|
BR-766
|
including |
511.6 |
515.0 |
3.4 |
3.0 |
5.20 |
|
|
BR-767
|
|
599.5 |
606.7 |
7.1 |
6.4 |
1.41 |
Viggo |
|
BR-767
|
and |
672.8 |
675.8 |
3.0 |
2.3 |
1.09 |
|
|
BR-768
|
|
798.5 |
803.0 |
4.5 |
3.7 |
1.29 |
Yauro |
|
BR-768
|
and |
884.7 |
890.7 |
6.1 |
4.8 |
0.84 |
|
|
BR-769
|
No significant intersections |
Yauro |
|
BR-770
|
|
1,288.0 |
1,291.0 |
3.0 |
2.1 |
0.51 |
Auro |
|
BR-770
|
and |
1,368.8 |
1,396.2 |
27.4 |
20.8 |
0.84 |
|
|
BR-770
|
and |
1,524.3 |
1,534.5 |
10.2 |
8.3 |
0.68 |
|
|
BR-770
|
and |
1,631.3 |
1,635.8 |
4.5 |
3.3 |
0.43 |
|
|
BR-770
|
and |
1,659.3 |
1,662.3 |
3.0 |
2.7 |
2.91 |
|
|
BR-771
|
|
1,235.6 |
1,254.1 |
18.5 |
16.7 |
0.47 |
Auro |
|
BR-771
|
and |
1,386.0 |
1,389.2 |
3.2 |
2.8 |
0.65 |
|
|
BR-772
|
|
1,317.0 |
1,320.0 |
3.0 |
2.6 |
0.64 |
Discovery |
|
BR-772
|
and |
1,368.0 |
1,399.5 |
31.5 |
24.6 |
0.67 |
|
|
BR-772
|
and |
1,413.0 |
1,427.4 |
14.3 |
10.2 |
0.57 |
|
|
BR-773
|
|
842.9 |
849.1 |
6.2 |
4.5 |
0.45 |
Bruma |
|
BR-780
|
|
842.9 |
846.3 |
3.4 |
2.9 |
1.38 |
Bruma |
|
BR-780
|
and |
906.0 |
922.7 |
16.7 |
14.0 |
0.92 |
|
|
BR-780
|
and |
941.6 |
947.2 |
5.6 |
5.0 |
1.12 |
|
|
BR-781
|
|
689.6 |
699.0 |
9.5 |
8.2 |
0.45 |
Bruma |
|
BR-781
|
and |
777.0 |
791.2 |
14.2 |
10.1 |
0.48 |
|
|
BR-781
|
and |
804.0 |
821.3 |
17.3 |
13.3 |
0.46 |
|
|
BR-782A
|
No significant intersections |
Bruma |
|
BR-783
|
|
648.8 |
651.8 |
3.0 |
2.2 |
2.00 |
Bruma |
|
BR-783
|
and |
939.8 |
943.2 |
3.4 |
3.1 |
0.44 |
|
|
BR-793
|
No significant intersections |
Yauro |
|
BR-794
|
|
942.0 |
953.5 |
11.5 |
9.0 |
3.77 |
Yauro |
|
BR-794
|
including |
942.0 |
944.0 |
2.0 |
1.6 |
6.54 |
|
|
BR-794
|
and including |
952.0 |
952.8 |
0.8 |
0.6 |
35.60 |
|
|
BR-794
|
and |
964.0 |
972.0 |
8.0 |
7.0 |
24.38 |
|
|
BR-794
|
and |
997.4 |
1,013.0 |
15.7 |
11.4 |
1.76 |
|
|
BR-794
|
and |
1,083.6 |
1,088.7 |
5.1 |
3.9 |
1.23 |
|
|
BR-800
|
|
817.0 |
820.0 |
3.0 |
2.1 |
1.40 |
Auro |
|
BR-800
|
and |
840.0 |
843.0 |
3.0 |
2.6 |
0.39 |
|
|
DL-083
|
|
663.6 |
673.6 |
10.1 |
7.7 |
5.57 |
Limb |
|
DL-083
|
including |
664.5 |
673.6 |
9.1 |
7.0 |
6.05 |
|
|
DL-088
|
No significant intersections |
Limb |
|
DL-089
|
No significant intersections |
Limb |
|
DL-114
|
|
237.1 |
240.6 |
3.5 |
2.7 |
0.68 |
Limb |
|
DL-114
|
and |
829.0 |
834.1 |
5.1 |
4.2 |
2.01 |
|
|
DL-117
|
|
873.1 |
876.8 |
3.7 |
2.7 |
2.41 |
Limb |
|
DL-132
|
|
898.1 |
904.8 |
6.7 |
5.4 |
3.62 |
Limb |
|
DL-132
|
including |
899.1 |
904.8 |
5.7 |
4.6 |
4.14 |
|
|
DL-132
|
and |
1,059.9 |
1,066.7 |
6.8 |
5.9 |
7.75 |
|
|
DL-132
|
including |
1,060.9 |
1,061.5 |
0.6 |
0.5 |
76.40 |
|
|
DL-133
|
|
19.7 |
52.5 |
32.8 |
28.5 |
0.81 |
Limb |
|
DL-134
|
|
918.1 |
921.5 |
3.4 |
2.8 |
1.60 |
Limb |
Results are preliminary in nature and are subject to on-going QA/QC. Lengths are subject to rounding.
APPENDIX B
LP Fault zone long section
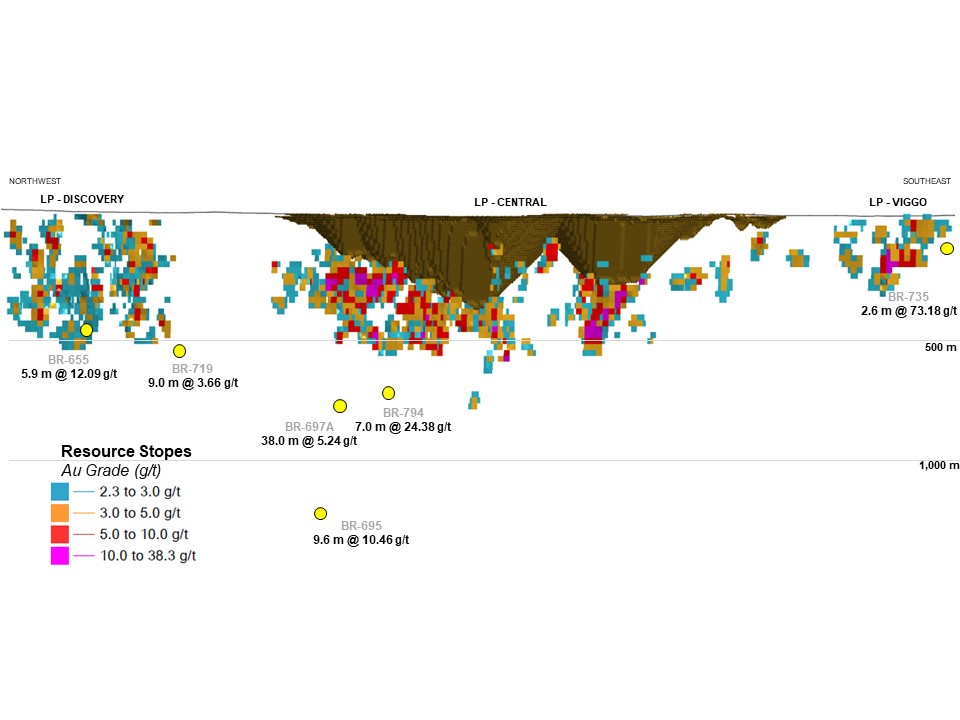
A photo accompanying this announcement is available at https://www.globenewswire.com/NewsRoom/AttachmentNg/6b8a3d42-cd78-4023-901c-4385be0bc7a9
Composites generated from drill intersections received since the February 13, 2023 news release includes assays from 52 fully assayed drill holes at the LP Fault zone and 8 at the Limb zone. Composites are generated using 0.3 g/t minimum grade, maximum linear internal dilution of 5.0 m, and allows short high-grade intervals greater than 8 GXM to be retained. Results are preliminary in nature and are subject to on-going QA/QC. For full list of significant, composited assay results, see Appendix A.
Cautionary statement on forward-looking information
All statements, other than statements of historical fact, contained or incorporated by reference in this news release including, but not limited to, any information as to the future financial or operating performance of Kinross, constitute “forward-looking information” or “forward-looking statements” within the meaning of certain securities laws, including the provisions of the Securities Act (Ontario) and the provisions for “safe harbor” under the United States Private Securities Litigation Reform Act of 1995 and are based on expectations, estimates and projections as of the date of this news release. Forward-looking statements contained in this news release, include, but are not limited to, those under the headings (or headings that include) “Q1 2023 highlights from continuing operations”, “Operational and development project highlights”, “CEO commentary”, “Return of capital”, “Operating results”, “Development project and exploration update”, “Company Guidance”, and “Environment, Social and Governance (ESG) update” as well as statements with respect to our guidance for production, cost guidance, including production costs of sales, all-in sustaining cost of sales, and capital expenditures; statements with respect to our guidance for cash flow and free cash flow; the declaration, payment and sustainability of the Company’s dividends or share repurchases; identification of additional resources and reserves; the Company’s liquidity;
greenhouse gas reduction initiatives and targets; the implementation and effectiveness of the Company’s ESG strategy; the schedules and budgets for the Company’s development projects; budgets for and future prospects for exploration, development and operation at the Company’s operations and projects, including the Great Bear project, ramp-up at La Coipa, the Tasiast 24k project, Manh Choh and the Tasiast solar project; and the Company’s liquidity outlook, as well as references to other possible events, the future price of gold and silver, the timing and amount of estimated future production, costs of production, operating costs; price inflation; capital expenditures, costs and timing of the development of projects and new deposits, estimates and the realization of such estimates (such as mineral or gold reserves and resources or mine life), success of exploration, development and mining, currency fluctuations, capital requirements, project studies, government regulation, permit applications, restarting suspended or disrupted operations; environmental risks and proceedings; and resolution of pending litigation. The words “advance”, “believe”, “continue”, “estimates”, “expects”, “focus”, “forecast”, “guidance”, “on schedule”, “on track”, “opportunity” “outlook”, “plan”, “poised”, “potential”, “priority”, “prospect”, or variations of or similar such words and phrases or statements that certain actions, events or results may, could, should or will be achieved, received or taken, or will occur or result and similar such expressions identify forward-looking statements. Forward-looking statements are necessarily based upon a number of estimates and assumptions that, while considered reasonable by Kinross as of the date of such statements, are inherently subject to significant business, economic and competitive uncertainties and contingencies. The estimates, models and assumptions of Kinross referenced, contained or incorporated by reference in this news release, which may prove to be incorrect, include, but are not limited to, the various assumptions set forth herein and in our Management’s Discussion and Analysis (“MD&A”) for the year ended December 31, 2022, and the Annual Information Form dated March 31, 2022 as well as: (1) there being no significant disruptions affecting the operations of the Company, whether due to extreme weather events (including, without limitation, excessive snowfall, excessive or lack of rainfall, in particular, the potential for further production curtailments at Paracatu resulting from insufficient rainfall and the operational challenges at Fort Knox and Bald Mountain resulting from excessive rainfall or snowfall, which can impact costs and/or production) and other or related natural disasters, labour disruptions (including but not limited to strikes or workforce reductions), supply disruptions, power disruptions, damage to equipment, pit wall slides or otherwise; (2) permitting, development, operations and production from the Company’s operations and development projects being consistent with Kinross’ current expectations including, without limitation: the maintenance of existing permits and approvals and the timely receipt of all permits and authorizations necessary for the operation of Tasiast; water and power supply and continued operation of the tailings reprocessing facility at Paracatu; permitting of the Great Bear project (including the consultation process with Indigenous groups), permitting and development of the Lobo-Marte project; ramp-up of production at the La Coipa project; in each case in a manner consistent with the Company’s expectations; and the successful completion of exploration consistent with the Company’s expectations at the Company’s projects; (3) political and legal developments in any jurisdiction in which the Company operates being consistent with its current expectations including, without limitation, restrictions or penalties imposed, or actions taken, by any government, including but not limited to amendments to the mining laws, and potential power rationing and tailings facility regulations in Brazil (including those related to financial assurance requirements), potential amendments to water laws and/or other water use restrictions and regulatory actions in Chile, new dam safety regulations, potential amendments to minerals and mining laws and energy levies laws, new regulations relating to work permits, potential amendments to customs and mining laws (including but not limited to amendments to the VAT) and the potential application of the tax code in Mauritania, potential amendments to and enforcement of tax laws in Mauritania (including, but not limited to, the interpretation, implementation, application and enforcement of any such laws and amendments thereto), and the impact of any trade tariffs being consistent with Kinross’ current expectations; (4) the completion of studies, including optimization studies, improvement studies; scoping studies and preliminary economic assessments, pre-feasibility and feasibility studies, on the timelines currently expected and the results of those studies being consistent with Kinross’ current expectations; (5) the exchange rate between the Canadian dollar, Brazilian real, Chilean peso, Mauritanian ouguiya and the U.S. dollar being approximately consistent with current levels; (6) certain price assumptions for gold and silver; (7) prices for diesel, natural gas, fuel oil, electricity and other key supplies being approximately consistent with the Company’s expectations; (8) attributable production and cost of sales forecasts for the Company meeting expectations; (9) the accuracy of the current mineral reserve and mineral resource estimates of the Company and Kinross’ analysis thereof being consistent with expectations (including but not limited to ore tonnage and ore grade estimates), future mineral resource and mineral reserve estimates being consistent with preliminary work undertaken by the Company, mine plans for the Company’s current and future mining operations, and the Company’s internal models; (10) labour and materials costs increasing on a basis consistent with Kinross’ current expectations; (11) the terms and conditions of the legal and fiscal stability agreements for Tasiast being interpreted and applied in a manner consistent with their intent and Kinross’ expectations and without material amendment or formal dispute (including without limitation the application of tax, customs and duties exemptions and royalties); (12) asset impairment potential; (13) the regulatory and legislative regime regarding mining, electricity production and transmission (including rules related to power tariffs) in Brazil being consistent with Kinross’ current expectations; (14) access to capital markets, including but not limited to maintaining our current credit ratings consistent with the Company’s current expectations; (15) potential direct or indirect operational impacts resulting from infectious diseases or pandemics such as COVID-19; (16) changes in national and local government legislation or other government actions; (17) litigation, regulatory proceedings and audits, and the potential ramifications thereof, being concluded in a manner consistent with the Corporation’s expectations (including without limitation litigation in Chile relating to the alleged damage of wetlands and the scope of any remediation plan or other environmental obligations arising therefrom); (18) the Company’s financial results, cash flows and future prospects being consistent with Company expectations in amounts sufficient to permit sustained share repurchases and dividend payments; (19) the impacts of detected pit wall instability at Round Mountain and Bald Mountain being consistent with the Company’s expectations; (20) the Company’s estimates regarding the timing of completion of the Tasiast 24k project; and (21) that deferred payments in respect of the Ghana divestiture will be paid and, in the event any deferred payment is not paid, the applicable security package will be realized and enforceable in a manner consistent with the Company’s expectations. Known and unknown factors could cause actual results to differ materially from those projected in the forward-looking statements. Such factors include, but are not limited to: the inaccuracy of any of the foregoing assumptions; fluctuations in the currency markets; fluctuations in the spot and forward price of gold or certain other commodities (such as fuel and electricity); price inflation of goods and services; changes in the discount rates applied to calculate the present value of net future cash flows based on country-specific real weighted average cost of capital; changes in the market valuations of peer group gold producers and the Company, and the resulting impact on market price to net asset value multiples; changes in various market variables, such as interest rates, foreign exchange rates, gold or silver prices and lease rates, or global fuel prices, that could impact the mark-to-market value of outstanding derivative instruments and ongoing payments/receipts under any financial obligations; risks arising from holding derivative instruments (such as credit risk, market liquidity risk and mark-to-market risk); changes in national and local government legislation, taxation (including but not limited to income tax, advance income tax, stamp tax, withholding tax, capital tax, tariffs, value-added or sales tax, capital outflow tax, capital gains tax, windfall or windfall profits tax, production royalties, excise tax, customs/import or export taxes/duties, asset taxes, asset transfer tax, property use or other real estate tax, together with any related fine, penalty, surcharge, or interest imposed in connection with such taxes), controls, policies and regulations; the security of personnel and assets; political or economic developments in Canada, the United States, Chile, Brazil, Mauritania or other countries in which Kinross does business or may carry on business; business opportunities that may be presented to, or pursued by, us; our ability to successfully integrate acquisitions and complete divestitures; operating or technical difficulties in connection with mining, development or refining activities; employee relations; litigation or other claims against, or regulatory investigations and/or any enforcement actions, administrative orders or sanctions in respect of the Company (and/or its directors, officers, or employees) including, but not limited to, securities class action litigation in Canada and/or the United States, environmental litigation or regulatory proceedings or any investigations, enforcement actions and/or sanctions under any applicable anti-corruption, international sanctions and/or anti-money laundering laws and regulations in Canada, the United States or any other applicable jurisdiction; the speculative nature of gold exploration and development including, but not limited to, the risks of obtaining and maintaining necessary licenses and permits; diminishing quantities or grades of reserves; adverse changes in our credit ratings; and contests over title to properties, particularly title to undeveloped properties. In addition, there are risks and hazards associated with the business of gold exploration, development and mining, including environmental hazards, industrial accidents, unusual or unexpected formations, pressures, cave-ins, flooding and gold bullion losses (and the risk of inadequate insurance, or the inability to obtain insurance, to cover these risks). Many of these uncertainties and contingencies can directly or indirectly affect, and could cause, Kinross’ actual results to differ materially from those expressed or implied in any forward-looking statements made by, or on behalf of, Kinross, including but not limited to resulting in an impairment charge on goodwill and/or assets. There can be no assurance that forward-looking statements will prove to be accurate, as actual results and future events could differ materially from those anticipated in such statements. Forward-looking statements are provided for the purpose of providing information about management’s expectations and plans relating to the future. All of the forward-looking statements made in this news release are qualified by this cautionary statement and those made in our other filings with the securities regulators of Canada and the United States including, but not limited to, the cautionary statements made in the “Risk Analysis” section of our MD&A for the year ended December 31, 2022, and the “Risk Factors” set forth in the Company’s Annual Information Form dated March 31, 2023. These factors are not intended to represent a complete list of the factors that could affect Kinross. Kinross disclaims any intention or obligation to update or revise any forward-looking statements or to explain any material difference between subsequent actual events and such forward-looking statements, except to the extent required by applicable law.
Key Sensitivities
Approximately 70%-80% of the Company’s costs are denominated in U.S. dollars.
A 10% change in foreign currency exchange rates would be expected to result in an approximate $20 impact on production cost of sales per equivalent ounce sold12.
Specific to the Brazilian real, a 10% change in the exchange rate would be expected to result in an approximate $30 impact on Brazilian production cost of sales per equivalent ounce sold.
Specific to the Chilean peso, a 10% change in the exchange rate would be expected to result in an approximate $50 impact on Chilean production cost of sales per equivalent ounce sold.
A $10 per barrel change in the price of oil would be expected to result in an approximate $3 impact on production cost of sales per equivalent ounce sold.
A $100 change in the price of gold would be expected to result in an approximate $4 impact on production cost of sales per equivalent ounce sold as a result of a change in royalties.
Other information
Where we say “we”, “us”, “our”, the “Company”, or “Kinross” in this news release, we mean Kinross Gold Corporation and/or one or more or all of its subsidiaries, as may be applicable.
The technical information about the Company’s mineral properties contained in this news release has been prepared under the supervision of Mr. John Sims who is a “qualified person” within the meaning of National Instrument 43-101.
All dollar amounts are expressed as U.S. dollars, unless otherwise noted.
Source: Kinross Gold Corporation
1
“Production cost of sales from continuing operations per equivalent ounce sold” is defined as production cost of sales, as reported on the interim condensed consolidated statements of operations, divided by total gold equivalent ounces sold from continuing operations.
2
These figures are non-GAAP financial measures and ratios, as applicable, and are defined and reconciled on pages 17 to 22 of this news release. Non-GAAP financial measures and ratios have no standardized meaning under IFRS and therefore, may not be comparable to similar measures presented by other issuers.
3
“Margins” from continuing operations per equivalent ounce sold is defined as average realized gold price per ounce from continuing operations less production cost of sales from continuing operations per equivalent ounce sold.
4
Operating cash flow figures in this release represent “Net cash flow of continuing operations provided from operating activities,” as reported on the interim condensed consolidated statements of cash flows.
5
Reported net earnings figures in this news release represent “Net earnings from continuing operations attributable to common shareholders,” as reported on the interim condensed consolidated statements of operations.
6
Adjusted net earnings figures in this news release represent “Adjusted net earnings from continuing operations attributable to common shareholders.”
7
“Total liquidity” is defined as the sum of
cash and cash equivalents, as reported on the interim condensed consolidated balance sheets, and available credit under the Company’s credit facilities (as calculated in Section 6 – Liquidity and Capital Resources of Kinross’ MD&A for the three months ended March 31, 2023).
8
Total working capital changes is defined as the sum of the changes in operating assets and liabilities, including income taxes paid, as reported on the interim condensed consolidated statements of cash flows (as shown in the adjusted operating cash flow from continuing operations reconciliation table on page 18 of this news release).
9
“Available credit” is defined as available credit under the Company’s credit facilities and is calculated in
Section 6 – Liquidity and Capital Resources of Kinross’ MD&A for the three months ended March 31, 2023.
10
Attributable production guidance includes Kinross’ share of Manh Choh (70%) production.
11
Attributable capital expenditure guidance includes Kinross’ share of Manh Choh (70%) capital expenditures.
12
Refers to all of the currencies in the countries where the Company has mining operations, fluctuating simultaneously by 10% in the same direction, either appreciating or depreciating, taking into consideration the impact of hedging and the weighting of each currency within our consolidated cost structure.


Appendix B: LP Fault zone long section
Composites generated from drill intersections received since the February 13, 2023 news release includes assays from 52 fully assayed drill holes at the LP Fault zone and 8 at the Limb zone. Composites are generated using 0.3 g/t minimum grade, maximum linear internal dilution of 5.0 m, and allows short high-grade intervals greater than 8 GXM to be retained. Results are preliminary in nature and are subject to on-going QA/QC. For full list of significant, composited assay results, see Appendix A.
Source: Kinross Gold Corporation